
Changes in Voice Quality after a Pure Tone Stimulation (PTS) Program
Cambios en la calidad vocal después de un Programa de Estimulación con Tonos Puros (PTS)
Lady Catherine Cantor-Cutiva , Pasquale Bottalico, Juliana Codino, Eric J. Hunter, Adam D. Rubin, Maria Cristina Jackson-Menaldi †
Abstract
Introduction. Auditory feedback allows individuals to monitor their vocal characteristics and adjust to maintain optimal voice quality. One type of auditory stimulation for conversational voice training/therapy is pure tone stimulation. This technique presents binaural auditory stimuli consisting of pure tones separated by half-step intervals to modify the fundamental frequency of the speaking voice and expand the vocal range.
Objectives. This study aimed to characterize detectable changes in voice production following the application of pure tone stimulation (PTS) among speakers with and without voice disorders.
Methods. Data from thirty-nine participants (28 individuals with voice disorders and 11 individuals with normal voices) were analyzed for this study. All participants engaged in binaural PTS exercises. Participants recorded a sustained vowel /a/ before and after the PTS exercises. Multiple acoustic voice parameters were extracted from the sustained vowel samples (fundamental frequency, pitch strength, harmonics-to-noise ratio, and smoothed cepstral peak prominence). Additionally, a visual analogue scale (VAS) interpretation of narrowband (NB) spectrograms was conducted to assess voice quality.
Results Statistically significant increases in fundamental frequency were found after the PTS exercises, except for males in the normal voices group. Pitch strength increased after the PTS, regardless of gender. Participants also demonstrated an increase in the harmonics-to-noise ratio. VAS ratings of NB spectrograms indicated improvement in voice quality following the program.
Conclusions. Voice changes after performing PTS suggest voice quality improvement, as measured by acoustic analysis of vowel production and qualitative assessment of NB spectrograms among participants with and without voice disorders.
Keywords
Voice; voice therapy; acoustics; spectrogram; pure tone stimulation.
Resumen
Introducción. La retroalimentación auditiva permite a los individuos monitorear sus características vocales y ajustarlas para mantener una calidad vocal óptima. La estimulación con tonos puros es un tipo de estimulación auditiva utilizada para el entrenamiento/terapia de la voz conversacional. Esta técnica presenta estímulos auditivos binaurales que consisten en tonos puros separados por intervalos de medio tono, con el fin de modificar la frecuencia fundamental de la voz hablada y ampliar el rango vocal.
Objetivos. Este estudio tuvo como objetivo caracterizar cambios detectables en la producción vocal después de la aplicación de estimulación con tonos puros (PTS) en hablantes con y sin desórdenes de la voz.
Métodos. Para este estudio se analizaron datos de treinta y nueve participantes (28 personas con trastornos de la voz y 11 personas con voces normales). Todos los participantes realizaron ejercicios binaurales de PTS. Los participantes grabaron una vocal sostenida /a/ antes y después de los ejercicios de PTS. Se extrajeron múltiples parámetros acústicos de las muestras de vocal sostenida -frecuencia fundamental, fuerza de tono (pitch strength), relación armónicos-ruido y prominencia de pico cepstral suavizado (CPPS)-. Además, se realizó análisis de los espectrogramas de banda estrecha (NB) utilizando una escala visual analógica (VAS) para evaluar la calidad vocal.
Resultados. Después de la PTS se encontraron aumentos estadísticamente significativos en la frecuencia fundamental, excepto para los hombres en el grupo con voces normales. La fuerza de tono aumentó después del programa, independientemente del género. Los participantes también demostraron un aumento en la relación armónicos-ruido. Las calificaciones de VAS de los espectrogramas NB indicaron una mejora en la calidad vocal después del programa.
Conclusiones. PTS demostró un efecto positivo en la mejora de la calidad vocal, medida a través del análisis acústico de la producción de vocales y la evaluación cualitativa de los espectrogramas NB.
Palabras clave
Voz; terapia vocal; acústica; espectrograma; estimulación con tonos puros
Introduction
Hearing is a crucial sensory modality that is pivotal in regulating voice production. Auditory feedback allows individuals to monitor their vocal characteristics and make adjustments to maintain optimal voice quality [1,2]. Therefore, this feedback is particularly important during speech, where talkers continuously adapt their pitch, loudness, and articulation to produce clear and intelligible speech [3].
The intricate relationship between hearing and voice has been recognized for decades. Early research highlighted the existence of a sound stimulation reflex pathway that influences the tone of the vocal fold muscles, known as the cochlear-vocal reflex [4]. This complex neuromuscular reflex system also referred to as kinesthetic feedback, is believed to contribute to the maintenance of vocal stability and pitch control [5]. Further investigations searched into the role of short-latency auditory-laryngeal reflexes in phonatory regulation demonstrating that auditory stimulation elicited rapid increases in voice fundamental frequency, with a linear relationship between stimulus magnitude and the observed response [6]. Short-latency electrical responses are defined as those that occur within a few milliseconds in the stimulated pathway after a stimulus. For the auditory-laryngeal reflex, it has been reported that this response was between 9 and 29 ms for the auditory-laryngeal pathways and brain stem structures to follow the fundamental frequency of complex auditory tones [7].
Another experimental study among healthy adults concluded that a short-latency change in fundamental frequency was presented as a response to auditory click-sound stimulation in both ears and when subjects received sound stimulation of more than 90 dB during high-pitch phonation, muscle activity, measured by electromyography, increased with a steady latency [8]. These findings suggest that auditory stimuli can have a direct and immediate impact on vocal parameters.
Based on these findings, various voice therapy techniques have incorporated auditory stimulation into their training programs. However, the evidence supporting the efficacy of these approaches is limited, and further research is warranted. One type of auditory stimulation for conversational voice training is pure tone stimulation (PTS) [9].
PTS involves presenting binaural auditory stimuli consisting of pure tones separated by half-step intervals. During PTS, participants are instructed to match their voice pitch to the tone they are hearing. The primary goal of PTS is to modify the fundamental frequency of the speaking voice and expand the vocal range. This technique was applied for several years in clinical settings by Dr. Jackson-Menaldi to treat patients with various voice disorders, including vocal fold paralysis, paresis (including superior laryngeal nerve injury), vocal fold atrophy, and vocal fold sulcus [9].
Despite the application of PTS in clinical practice, its effects on voice acoustic parameters and voice perception remain largely unexplored. Therefore, this study aims to characterize detectable changes in voice production following the application of pure tone stimulation (PTS) among speakers with and without voice disorders. Additionally, the study will employ a visual analogue scale (VAS) to analyze narrow band (NB) spectrograms to assess the perceived impact of PTS on voice quality.
By examining the effects of the PTS program on voice acoustic parameters and quality (analyzed using NB spectrograms), this study seeks to provide preliminary evidence for the potential benefits of this auditory stimulation technique in voice production. The findings of this study may inform future research directions and contribute to the development of more effective voice therapy interventions.
Methods
Design and Participants
Thirty-nine participants were included in this study. Of these, 28 were patients with voice disorders seeking voice therapy at a voice clinic, while 11 were healthy speakers with no history of voice disorders. The gender distribution among the patient group was 19 females and 9 males, with a mean age of 54 years old (SD = 17 y/o). Among participants with clinical diagnoses of voice disorders (n = 28), 17 had vocal fold paresis (61%), five had vocal fold paralysis (18%), three had vocal fold scar (11%), two had vocal fold atrophy (7%), and one had diagnosis of sulcus (4%). The group with no history of voice disorders consisted of college students from the Midwest of the USA, with a gender distribution of 8 females and 3 males (no prior voice problems, mean age = 22 years old; SD = 1 y/o).
The inclusion of both a group with and without voice disorders was crucial for the validity and generalizability of the study findings. The group with voice disorders (patient group) provided a direct assessment of the effectiveness of the PTS program among individuals with this condition, while the group of individuals with normal voices (control group) serves as a benchmark to compare against and control for potential confounding factors. Without a control group, it would be impossible to determine whether any observed changes in voice quality following the program were solely attributable to the intervention or other factors, such as natural fluctuations in voice production or exposure to other interventions. By comparing both groups, we can isolate the effects of the program and gain a clearer understanding of its true efficacy. Additionally, the control group can provide valuable insights into any potential side effects or adverse reactions associated with the PTS program.
Description of the Pure Tone Stimulation Protocol
Before starting, all participants underwent a hearing screening to guarantee normal hearing among all the subjects. Normal hearing will allow one to perceive, and therefore discriminate and match the pure tone stimulus. All participants performed the pure tone stimulation (PTS) protocol. The specific PTS exercises involved binaural auditory stimulation delivered through over-the-ear headphones using pure tones separated by half-steps. The frequencies of the pure tones ranged between 87 Hz and 350 Hz for males, and between 175 Hz and 698 Hz for females. However, the range will be adjusted to the participant's voice type. Upon presentation of each tone, participants were instructed to match their vocal pitch to the pitch of the pure tone while it played simultaneously. Participants produced the sound /hi/ (with a sense of forward focus) while maintaining good breath support. To reduce neck tension and promote proper breath support, participants were provided with a stress reduction ball and instructed to compress it with their hands to divert tension. The duration of the PTS program varied among patients depending on their diagnosis and prognosis, while for the controls, the PTS was implemented in a single session consisting of two repetitions, each lasting approximately 10 minutes. A detailed description of the PTS program is provided in Table 1, adhering to the Template for Intervention Description and Replication (TIDieR) checklist [10].
Table 1. Template for Intervention Description and Replication (TIDieR) checklist of the PTS.
| Program | |
|---|---|
| TIDier item | Description |
| Brief name | PTS Program |
| Why | The concept of PTS is based on the effect of auditory stimulation on laryngeal function because there is a sound stimulation reflex pathway that affects the tone of the muscles of the vocal folds (cochlear-vocal reflex) |
| What | For the implementation of the program, participants sat in a fixed chair, wore ear headphones, and pressed a stress reduction ball with one hand. |
| Who provided | For the patient group, the provider was a Speech-Language Pathologist with more than 30 years of experience. For the group of participants with normal voices, the provider was a Speech-Language Pathologist with more than 15 years of experience. |
| How | The PTS was provided in individual sessions that were delivered face-to-face. |
| Where | For the patient group, the sessions were delivered in a clinical setting, whereas for the group of participants with normal voices, the sessions were delivered in a sound booth located in a research lab. |
| When and How Much | For the patient group, the number of sessions depended on each pathology and progress. For the group of participants with normal voices, the program was delivered in one session. |
| Tailoring | The number and duration of the sessions of the PTS were planned to be personalized according to the progress of the patients. |
| Modifications | The program was delivered as planned. |
| How well | The adherence was not assessed. |
Equipment
Data collection was conducted at two separate locations for logistical reasons. Voice samples from participants with voice problems were recorded in a quiet examination room using a Kay Elemetrics Speech Lab (model 5200). For participants without voice problems, samples were captured using an omnidirectional microphone (M2211, NTi Audio, Tigards, OR, USA) positioned at a fixed distance of 30 cm from the mouth within a sound-isolated booth with a background noise level of 25 dB(A). The recordings from both groups were primarily analyzed using Praat 5.4/5.4.17 (Netherlands), with custom MATLAB R2017a (Mathworks, Natick, MA, USA) scripts employed for specific analyses and file management. Praat settings for fundamental frequency (fo) calculation were set to a pitch range between 150 Hz and 450 Hz for females and between 50 Hz and 350 Hz for males.
Voice samples
Before and following each PTS session, all participants recorded a sustained /ɑ/ vowel at a comfortable pitch and loudness. Patients' first recording was obtained during their initial clinic visit as part of their standard voice evaluation (pre-PTS). The second recording was acquired following treatment for their dysphonia (post-PTS). For participants without voice disorders, the first recording was obtained at the beginning of the session (pre-PTS), and the second recording was obtained after the PTS session (post-PTS). For this study, a one-second segment from the middle portion of the sustained vowel was utilized for acoustic measurements and qualitative visual ratings of narrowband (NB) spectrograms using a 10-centimeter visual analogue scale (VAS). This study received approval from the Institutional Human Research Protection Program (IRB#14-1054M).
Voice Parameters
A range of acoustic voice parameters were collected for historical comparison, clinical availability, and current trends. Thus, the following was extracted from the steady vowel productions: fundamental frequency, estimated pitch strength, harmonics-to-noise ratio, and cepstral peak prominence smoothed.
Estimated Pitch Strength (PS) is a perceptual attribute that can quantify two sounds with the same pitch, based on the saliency of their pitch sensation [11]. Therefore, PS is a tool that seems to correlate to the perception of dysphonic voice when breathiness and roughness are present [12].
Harmonics-to-Noise Ratio (HNR) is a measure that quantifies the relative amount of additive noise in the voice signal [13]. It indicates the overall periodicity of the voice signal by quantifying the ratio of the periodic to aperiodic (noise) components [14]. When the vocal folds are closed insufficiently, air passes through the glottis, giving rise to turbulence. The resulting frication noise is reflected in a higher noise level in the spectrum. HNR reflects voice quality and is a significant predictor of voice samples that are perceptually rated as rough [13].
Measures of Cepstral Peak Prominence Smoothed (CPPS) have become a standard acoustic metric on both steady vowel and running speech production. They have been shown to correlate well to degrees of severity in dysphonia as CPPS is robust to small errors in fundamental frequency tracking. The CPPS allows for comparison between two testing situations, as it provides the magnitude of the cepstral peak relative to the amplitude of phonation [15].
Narrow Band spectrogram visual ratings
The spectrogram has been part of voice and speech analysis for several decades. It consists of a three-dimensional graph that represents time on the horizontal axis, frequency on the vertical axis, and amplitude of the sound components by the color intensity or contrast in the tracing [16]. The interpretation of a spectrogram is subjective; it relies on a visual analysis performed by the clinician and the association of this analysis with laryngeal imaging and auditory-perceptual assessment.
Currently, there are two methods to classify voice signals based on NB spectrograms: the methods by Yanagihara [17] and Titze [18]. Yanagihara classifies the signal into 4 types and is based on the relation between the harmonic structure and the noise component in the signal. It analyzes the regularity of harmonics and the presence of noise across the spectrum which can be inter-harmonic or completely replacing harmonics. Titze proposed 3 signal types, based on nonlinear dynamics and the main criteria for classifying them is the presence of subharmonics (referred to as bifurcations) and noise in the spectrum. A fourth type to Titze’s classification was added by Sprecher, who based its classification on NB spectrograms, as well [19]. Type 4 signals may or may not exhibit fundamental frequency and display white noise across the spectrum, making them unsuitable for both perturbation and correlation dimension analysis. In an effort to standardize this subjective interpretation of the NB spectrogram, Rodrigues Bastilha et al. [20] developed a protocol for spectrographic vocal assessment (both NB and wideband) that includes 6 parameters including harmonics tracing and its definition/regularity, presence of noise (both interharmonic and replacing harmonics), complete or partial filling of the harmonic spectrum and presence of subharmonics [20].
For this study, two-dimensional spectrogram images were created from the narrow band (bandwidth 45 Hz) spectral analysis of each vowel, with a Hamming window (90% of temporal overlap), and the frequency range was set between 20 and 5000 Hz. These images were randomly presented to six individuals who rated the images using a VAS scale. The parameters to consider when performing the VAS ratings were: (a) harmonics (structure, definition, regularity, and intensity); (b) noise (interharmonic and/or replacing harmonics, intensity); (c) presence of subharmonics. Six raters were included. Three raters were speech-language pathologists: Rater 1 had more than 15 years of experience in vocal assessment and visual analysis of spectrographic data, and Raters 2 and 3 had 6 months of training in vocal assessment and spectrographic data by Rater 1. Raters 4, 5, and 6 were graduate students in speech-language pathology who underwent a 1-hour online training session with Rater 1. All Raters completed the spectrogram VAS independently into a survey platform (Qualtrics, Provo, UT) with de-identified data that was presented in a random order. The VAS was from 0 mm (normal voice quality) to 100 mm (severe dysphonia).
Statistical Analysis
Statistical analysis of the metrics was conducted using R version 4.0.2 [21]. Considering the aims of this study, Linear Mixed-Effects (LME) models were fit by restricted maximum likelihood (REML). Random effects terms were chosen based on the variance explained. Models were selected based on the Akaike information criterion (the model with the lowest value being preferred) [22], and the results of likelihood ratio tests (a significant result indicating that the more complex of the two nested models in the comparison is preferred) and were built using lme [23], lmerTest [24], and multcomp [25] packages. The LME output includes the estimates of the fixed effects coefficients, the standard error associated with the estimate, the degrees of freedom (df), the test statistic, and the p-value. The Satterthwaite method is used to approximate degrees of freedom and calculate p values. For the second aim, first, we assessed the NB spectrogram’s agreement between raters, the intraclass correlation coefficient (ICC) was used as described by Fleiss and Cohen [26]. Then, we used LME models to assess the association between dependent and independent variables.
LME models were run with six response variables (1) average of fundamental frequency (fo, Hz), (2) pitch strength (Ps, -), (3) Cepstral Peak Prominence Smoothed (CPPs, dB), (4) harmonic to noise ratio (HNR, dB), and (5) Spectrogram visual rating (SVR, %). The fixed factors used in the models were (1) Pre vs Post-treatment, (2) Patients vs group of participants with normal voices, and (3) gender; the random effect was the participant ID. Table 2 shows the models’ results.
Table 2. Linear-Mixed-Effects model outputs for the five response variables.
| Fixed factors | Estimate (-) | Std. Error (-) | df | t | p |
|---|---|---|---|---|---|
| fo (Hz) | |||||
| (Intercept) | 182.9 | 12.0 | 32 | 15.2 | <0.001*** |
| Pre vs Post: POST | 26.3 | 6.8 | 27 | 3.9 | <0.001*** |
| Patients vs Control: PATIENTS | 6.1 | 14.3 | 27 | 0.4 | 0.670 |
| Gender: MALE | -78.2 | 16.3 | 28 | -4.8 | <0.001*** |
| Ps (-) | |||||
| (Intercept) | 0.40 | 0.02 | 36 | 16.58 | <0.001*** |
| Pre vs Post: POST | 0.04 | 0.02 | 29 | 2.17 | 0.038* |
| Patients vs Control: PATIENTS | 0.02 | 0.03 | 29 | 0.76 | 0.455 |
| Gender: MALE | -0.01 | 0.03 | 30 | -0.28 | 0.785 |
| CPPs (dB) | |||||
| (Intercept) | 15.2 | 0.7 | 43 | 21.9 | 0.006** |
| Pre vs Post: POST | 1.3 | 0.7 | 29 | 1.8 | 0.079 |
| Patients vs Control: PATIENTS | -1.1 | 0.7 | 27 | -1.5 | 0.144 |
| Gender: MALE | 0.0 | 0.9 | 28 | 0.1 | 0.955 |
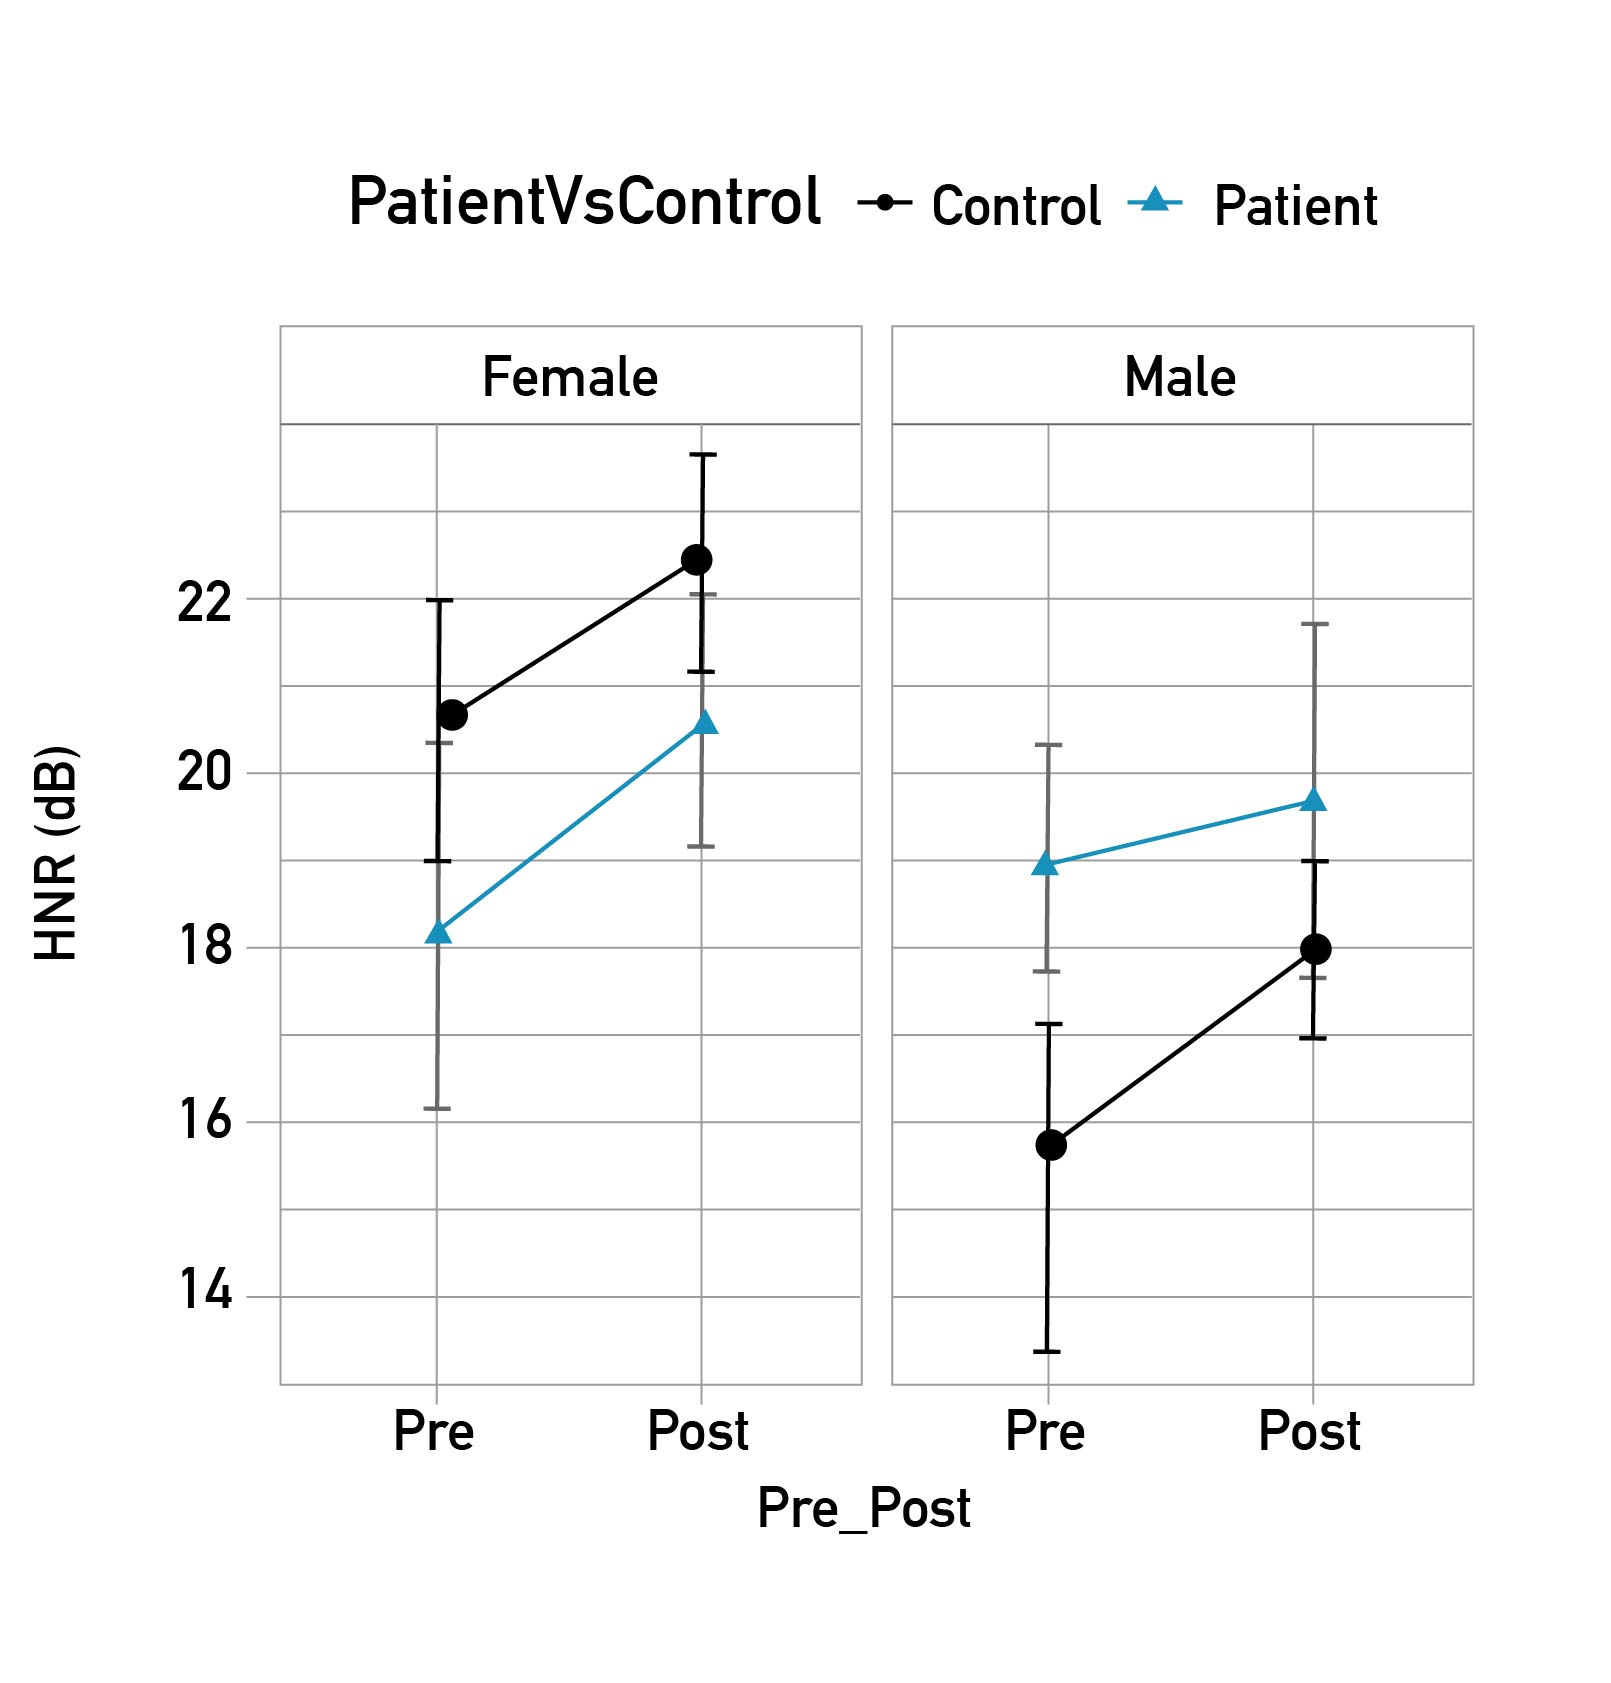
| HNR (dB) | |||||
| (Intercept) | 20.0 | 1.3 | 34 | 14.9 | <0.001*** |
| Pre vs Post: POST | 1.7 | 0.8 | 28 | 2.1 | 0.049* |
| Patients vs Control: PATIENTS | -1.1 | 1.6 | 29 | -0.7 | 0.498 |
| Gender: MALE | -1.6 | 1.8 | 30 | -0.9 | 0.369 |
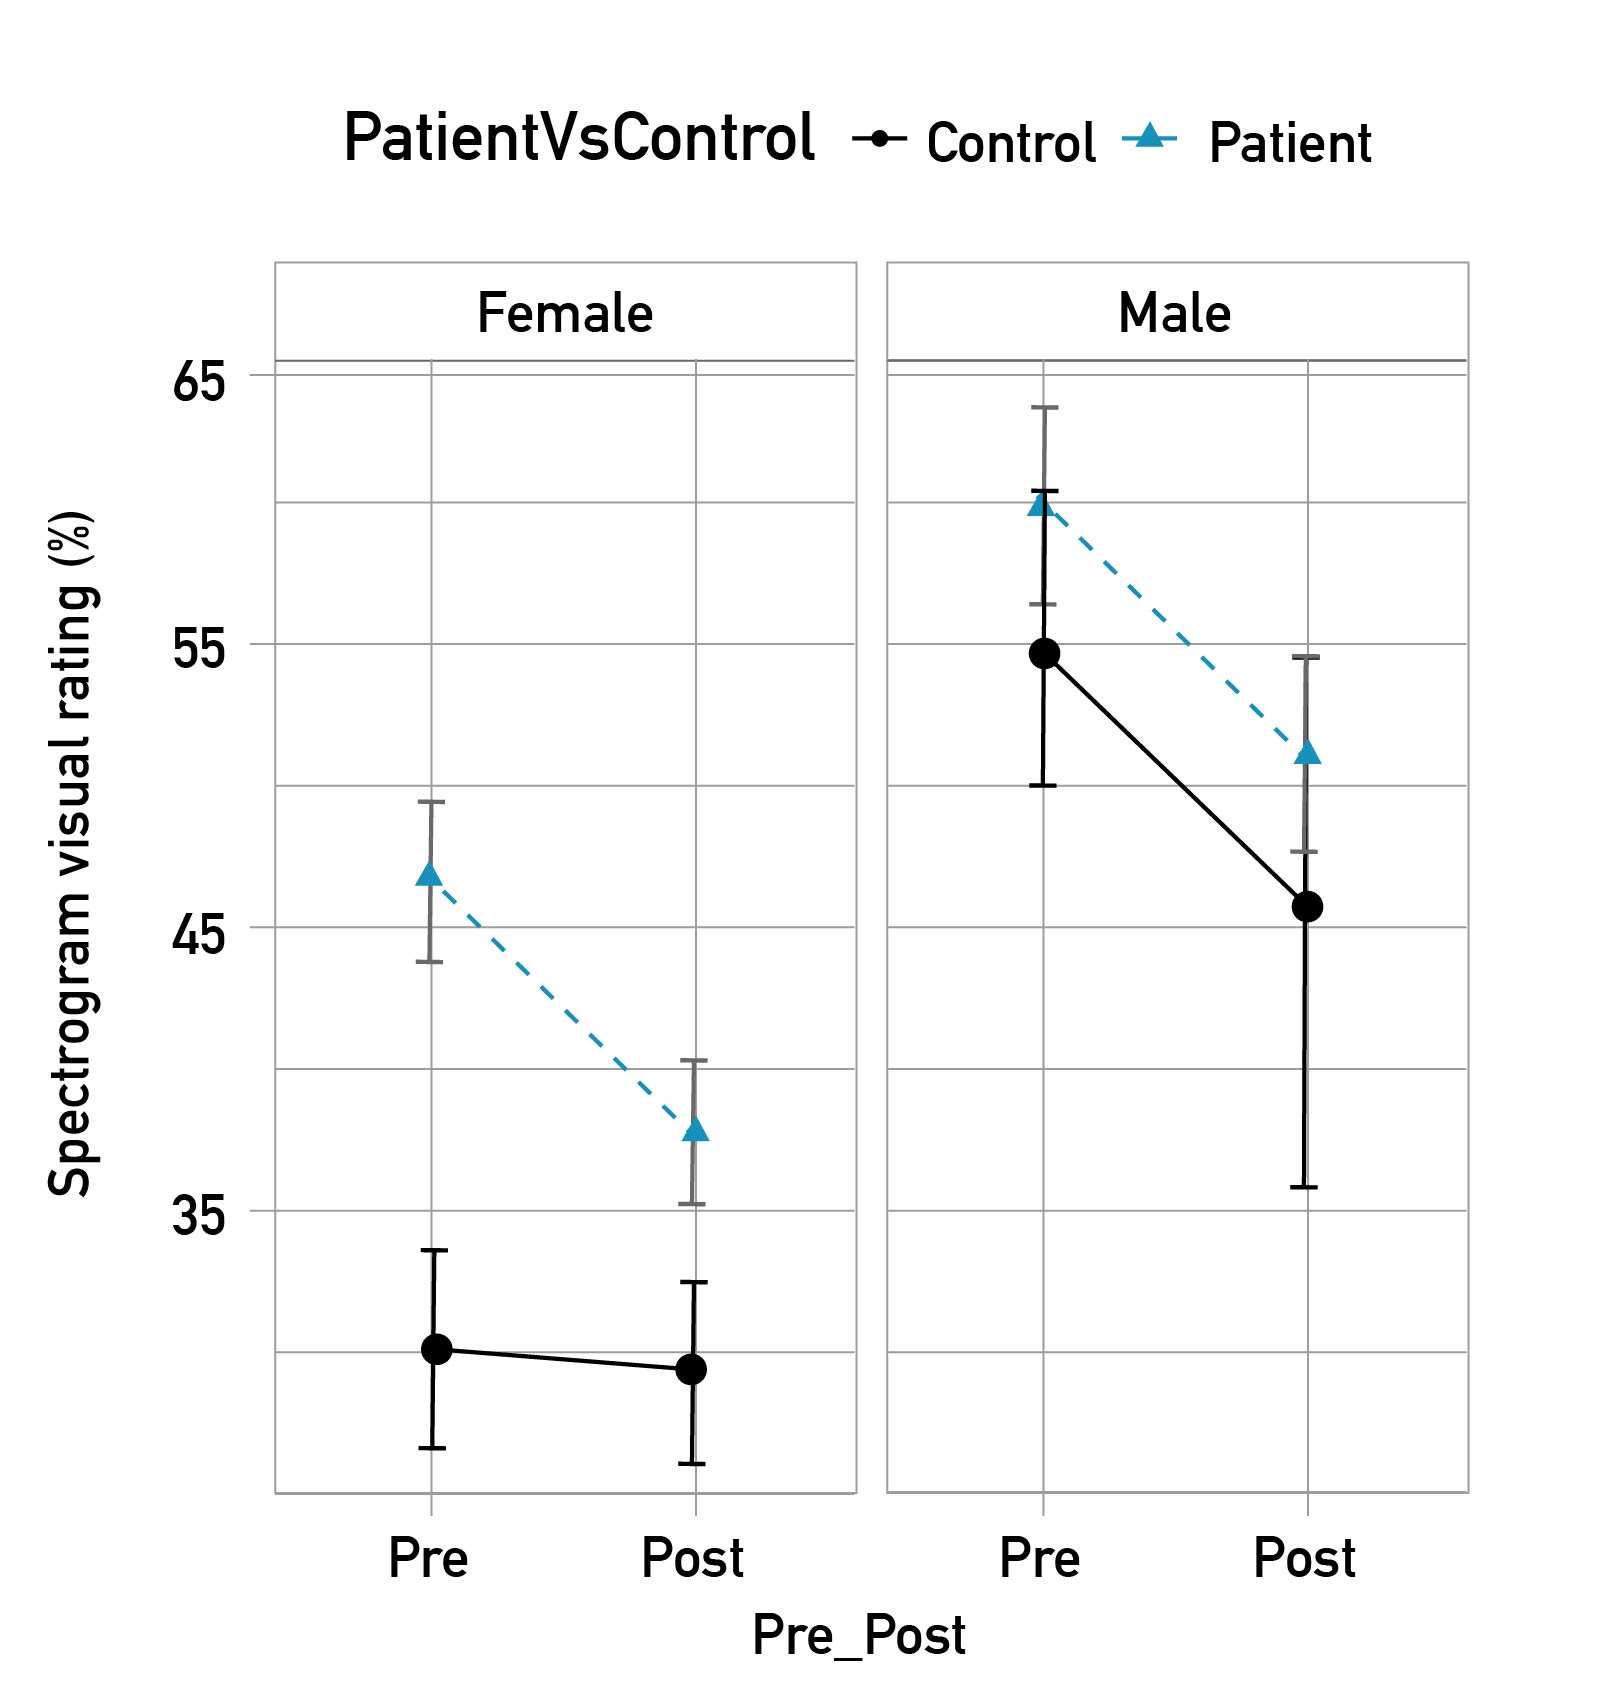
| Spectrogram visual rating (%) | |||||
| (Intercept) | 34.3 | 3.5 | 11 | 9.7 | <0.001*** |
| Pre vs Post: POST | -6.8 | 2.1 | 378 | -3.2 | 0.002** |
| Patients vs Control: PATIENTS | 10.5 | 2.2 | 378 | 4.7 | <0.001*** |
| Gender: MALE | 15.7 | 2.5 | 378 | 6.4 | <0.001*** |
Note. Linear-Mixed-Effects model outputs for the five response variables (1) average of fundamental frequency (fo, Hz), (2) pitch strength (Ps, -), (3) Cepstral Peak Prominence Smoothed (CPPs, dB), (4) harmonic to noise ratio (HNR, dB), and (5) Spectrogram visual rating (%). The fixed factors used in the models were (1) Pre vs Post-treatment, (2) Patients vs Group of participants with normal voices, and (3) gender; the random effect was the participant ID. Signif. Codes:’***’<0.001 ’**’<0.01 ’*’<0.05 ’.’<0.1
Results
A statistically significant increased fundamental frequencies were found in both groups after the implementation of PTS, except for the male group of participants with normal voices (189 Hz vs. 213 Hz for female controls; 185 Hz vs. 217 Hz for female patients; 96 Hz vs. 96 Hz for male controls; 120 Hz vs. 143 Hz for male patients). Figure 1 shows that PS increased after PTS independent of gender and type of participant (speakers with normal voice vs patient group) (0.41 pre - 0.45 post). No significant gender effects were found for the other parameters. However, we included these analyses for completeness and transparency. As shown in Figure 2, there was an overall tendency to have higher CPPS after PTS. Table 2 shows that after PTS participants showed an increased HNR. Figure 3 shows that the Harmonics-to-Noise Ratio increased among female controls (20.4 dB vs. 22.2 dB), female patients (18.2 dB vs. 20.6 dB), male control (15.4 dB vs. 18.1 dB), and male patients (19.1 dB vs. 19.6dB).
Figure 1. Mean and standard error (SE) of pitch strength (Ps, -) of the vowels produced by the participants in the two groups (Patients vs Control) Pre and Post PTS treatment, by gender.
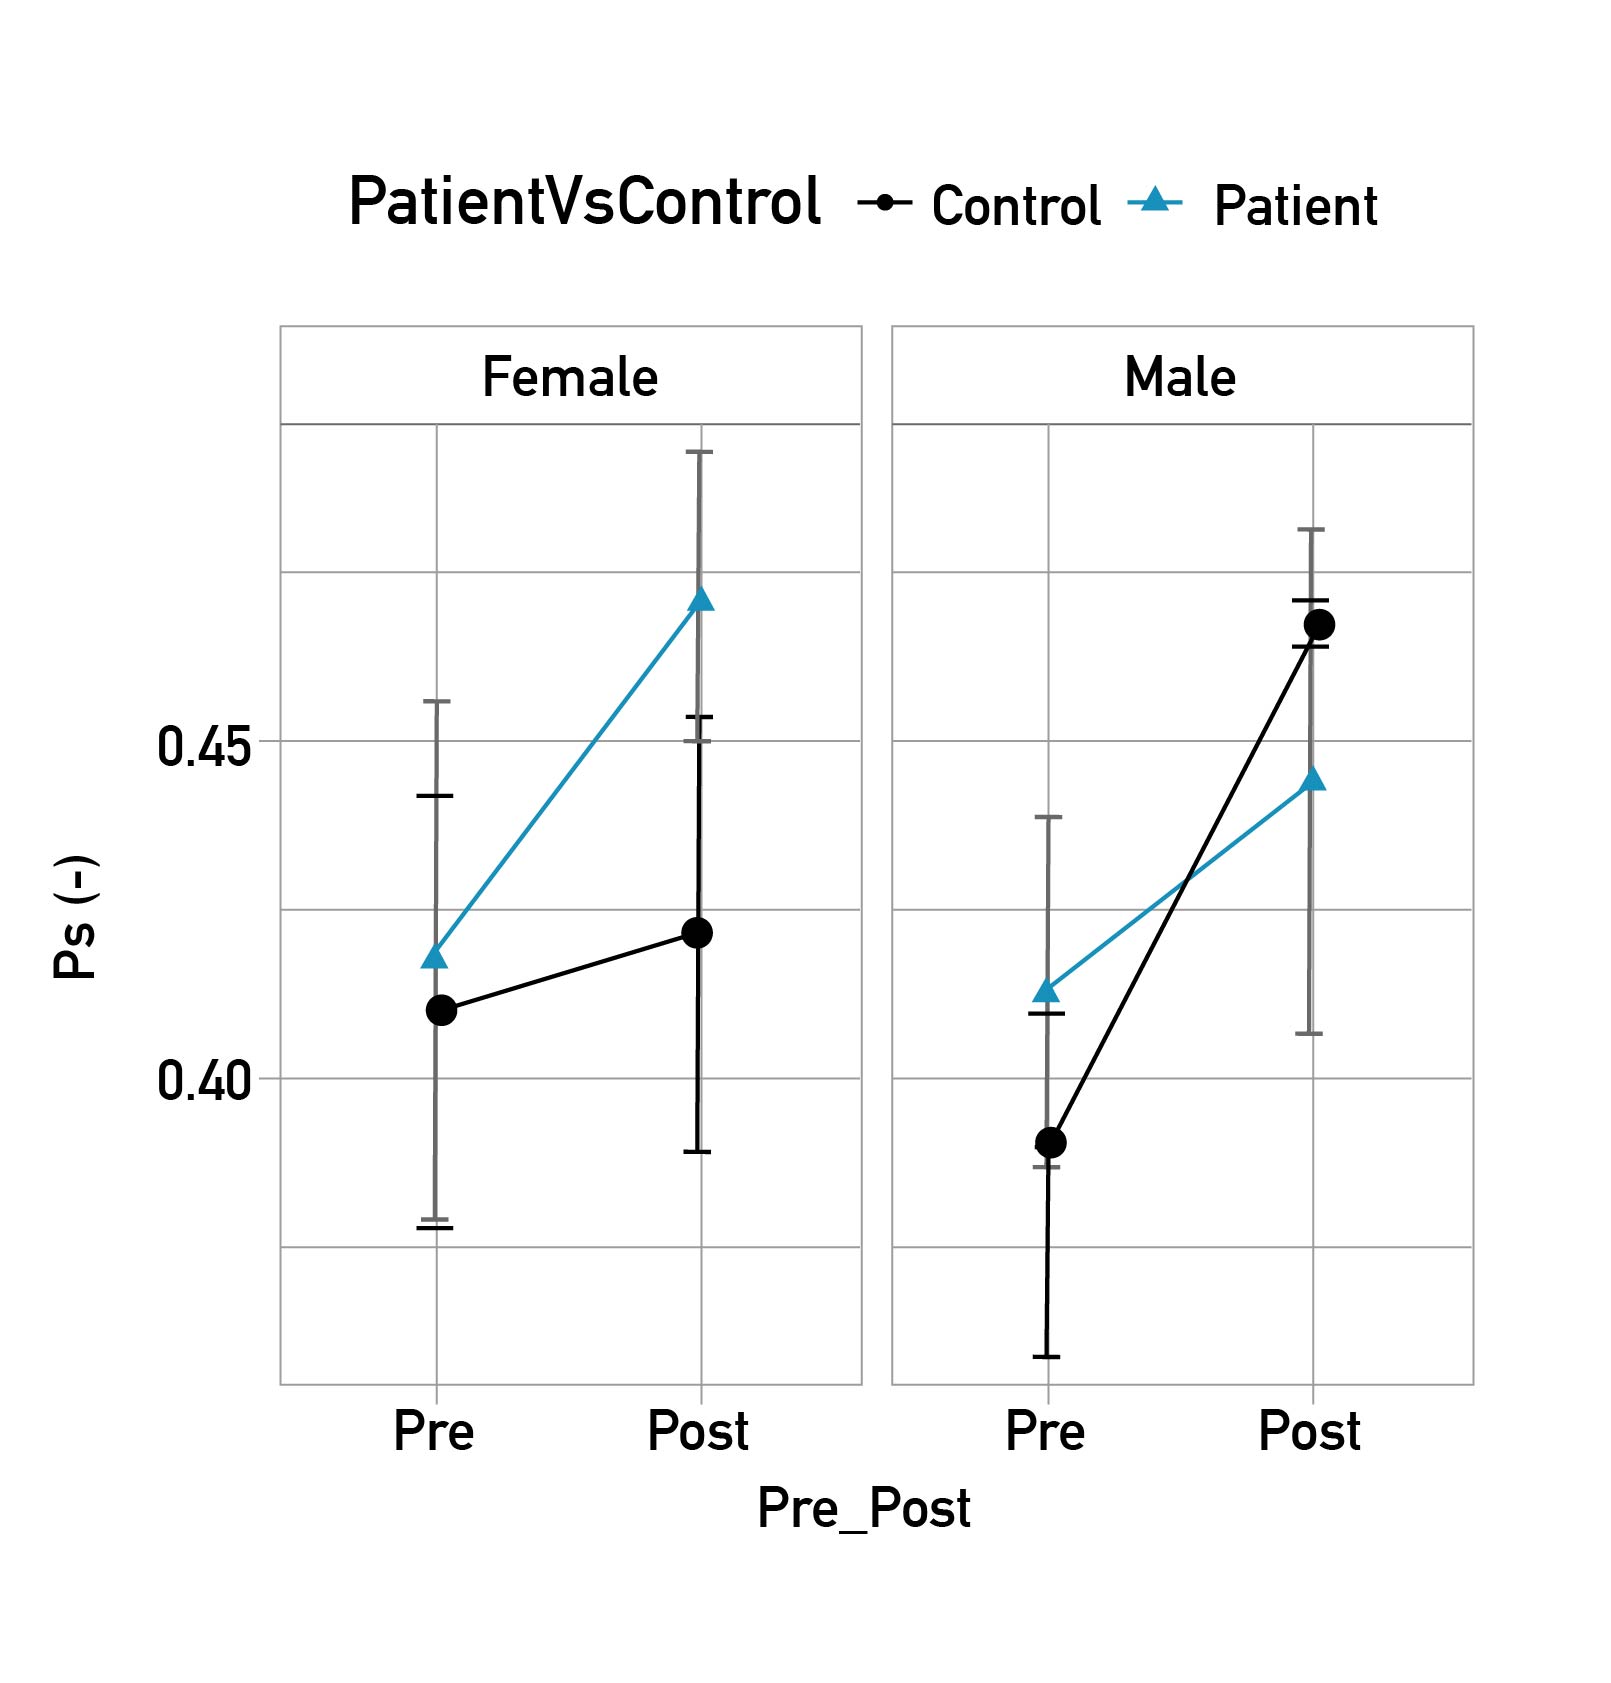
Figure 2. Mean and standard error (SE) of Cepstral Peak Prominence Smoothed (CPPs, dB) of the vowels produced by the participants in the two groups (Patients vs Control) Pre and Post PTS treatment, by gender.
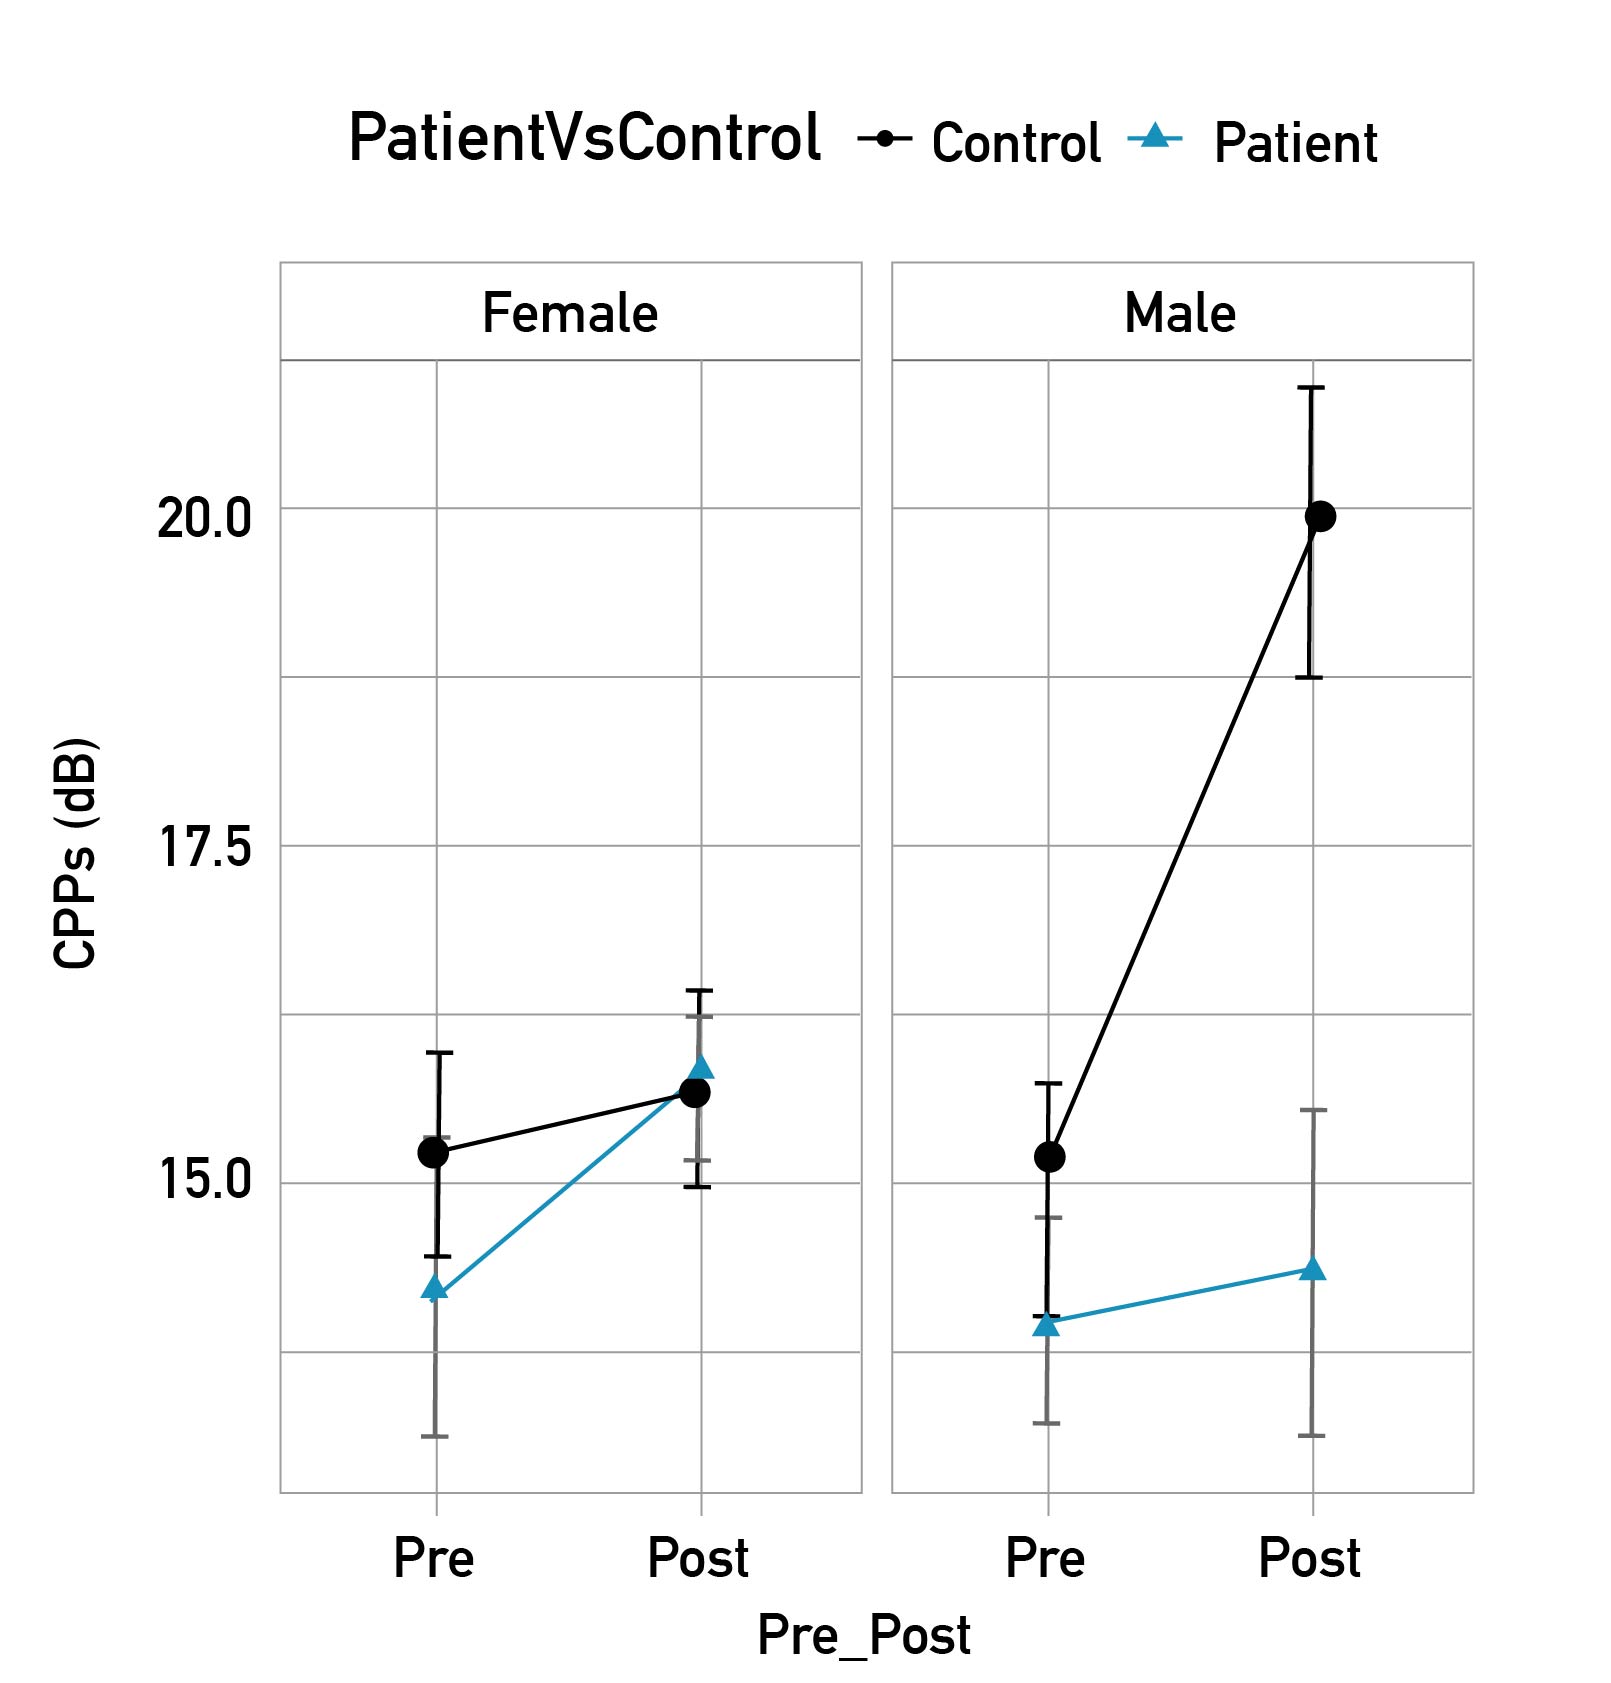
Figure 3. The mean and standard error (SE) of harmonic to noise ratio (HNR, dB) of the vowels produced by the participants in the two groups (Patients vs Control) Pre and Post PTS treatment, by gender.
Analysis of the NB spectrogram with the two-way mixed effects model and single score agreement was 0.21 (F (63,319) =2.56, p<0.001), which indicates that the strength of the agreement among the raters was fair [27]. As shown in Figure 4, after the PTS treatment the voice quality improved according to the VAS analysis (30.5 % vs. 29.5% for female controls - 46.5 % vs. 37.5 % for female patients - 55.4 % vs. 45.9 % for male controls - 60.3 % vs. 51.2 % for male patients). Overall, the patient group showed a lower voice quality compared to the group of participants with normal voices (11.9 % more dysphonic), and male voice quality was judged 17.1 % more dysphonic than females’ voice quality.
Figure 4. Mean and standard error (SE) of Spectrogram visual rating (%) of the vowels produced by the participants in the two groups (Patients vs Control) Pre and Post PTS treatment, by gender.
Discussion
This study investigated the effect of the PTS program on voice quality. Our findings showed a statistically significant effect of PTS on voice quality improvement among participants with and without voice disorders, supported by four key observations: firstly, a statistically significant increase in fundamental frequency (except for males without voice disorders); secondly, increased Pitch Strength and HNR; thirdly, an overall tendency towards higher CPPs; fourthly, an improvement in voice quality, as assessed through visual examination of NB spectrograms; fifthly, no significant gender effects were observed for parameters other than fundamental frequency, which aligns with expectations given the well-established differences in vocal anatomy and physiology between genders.
Since research reporting the use of PTS as a therapeutic approach for voice disorders is limited, our discussion will compare our results with two previous studies that assess the effect of PTS in voice production. Our findings align with those of numerous studies that have linked improvements in fo, PS, HNR, CPPs, and spectral analysis to improvements in voice quality [28-31]. The observed increase in voice fo following PTS implementation suggests a beneficial impact of this therapeutic approach for speakers with low fundamental frequency, a common feature arising from compensatory strategies employed by individuals with these disorders. These results agree with previous research that reported increased fo as the pitch of pure tone was shifted upward [32]. Our findings partially align with those of previous studies conducted on patients with functional and organic dysphonia, which also reported an increase in fundamental frequency and speaking frequency following voice therapy [33,34].
Concerning the second result on the observed increase in PS following PTS implementation suggests a potential reduction in perceived breathiness and roughness, two common symptoms among patients with vocal fold paralysis/paresis (depending on the position of the affected vocal fold), vocal fold scar and vocal fold atrophy leading to improved voice quality [12,35]. Additionally, our findings align with previous research that has reported higher PS after treatment of voice disorders associated with Muscle Tension Dysphonia (MTD)/functional dysphonia, vocal fold mass(es), and presbyphonia [12].
The effect of PTS on HNR, which represents the ratio between the periodic and random components of voiced speech, primarily arising from turbulent airflow through the glottis and pitch perturbations [36], is worth considering. Higher HNR values indicate more harmonious and healthier voices. Our findings reinforce the role of PTS in enhancing voice quality, as demonstrated by the increase in HNR. This result aligns with previous research demonstrating higher HNR following voice therapy [37-40].
Regarding the observed tendency towards higher CPPS following PTS implementation, CPP and CPPS measures have been shown to exhibit a strong correlation with both signal periodicity and perceptual voice assessment. Additionally, CPPS has been demonstrated to have a stronger correlation with overall voice quality compared to other acoustic measures. Consequently, the increase in CPPS following PTS suggests an improvement in voice quality, consistent with findings from previous studies that have reported similar outcomes among patients who underwent voice therapy for voice disorders [40,41].
The observed decrease in spectrogram VAS ratings following PTS implementation, which indicates our fifth finding on voice quality improvement, can be attributed to an overall enhancement in vocal function. This improvement manifests in the harmonic structure and intensity of the voice, as well as in a reduction of inter-harmonic noise and/or the presence of subharmonics [42,43].
This study has some limitations. The main issue is that other voice therapy techniques may have been used concurrently which could also have affected these measures. However, this would not take away from the effect of PTS noted in the control group. Furthermore, PTS was the main therapeutic technique used for the patients in the sample. Second, while other speech samples were possible in the group of participants with normal voices since the data from the group of patients with voice disorders were analyzed retrospectively, we analyzed exclusively those voice samples that were recorded for both groups. Third, the data analysis and instruments differed between groups, with one being retrospective and the other one prospective. However, we have taken steps to mitigate their impact. By employing statistical controls and conducting sensitivity analyses, we aimed to ensure that our findings were not unduly influenced by these factors. Fourth, the groups had different sample sizes, which may introduce bias to the analysis. However, the statistical approach used controlled by the effect of group, which aimed to reduce this bias. Lastly, the group of participants with normal voice was not matched either by gender or age with the patient group, which may insert bias into our analysis because gender and age are variables associated with voice production. Nevertheless, our results suggest that the effect of PTS on voice production is consistent across groups.
Conclusion
In conclusion, our results suggest that PTS exercises may be beneficial in the improvement of voice quality measured using voice acoustic parameters and NB spectrograms. PTS, or other kinesthetic feedback protocol, could be used as part of a larger tool set by a voice therapist when working to stimulate quality voice production. Future studies with larger sample sizes to further validate our results and directly compare PTS to other treatment modalities may be useful.
Reference
1. Howard D, Hunter EJ. 10. Perceptual features in singing. In Welch GF, Howard DM, Nix J, editors. The Oxford Handbook of Singing [Internet]. Oxford: Oxford Academic; 2016. p. 225-40. doi: https://doi.org/10.1093/oxfordhb/9780199660773.013.34
2. Hunter EJ, Švec JG, Titze IR. Comparison of the produced and perceived voice range profiles in untrained and trained classical singers. J Voice [Internet]. 2006;20(4):513-26. doi: https://doi.org/10.1016/j.jvoice.2005.08.009
3. Burnett TA, Freedland MB, Larson CR, Hain TC. Voice F0 responses to manipulations in pitch feedback. J Acoust Soc Am [Internet]. 1998;103(6):3153-61. doi: https://doi.org/10.1121/1.423073
4. Husson R. Physiologie de la phonation. 1st ed. Paris: Masson; 1962. 590 p.
5. Mürbe D, Pabst F, Hofmann G, Sundberg J. Significance of auditory and kinesthetic feedback to singers' pitch control. J Voice [Internet]. 2002;16(1):44-51. doi: https://doi.org/10.1016/S0892-1997(02)00071-1
6. Sapir S, McClean MD, Larson CR. Human laryngeal responses to auditory stimulation. The J Acoust Soc Am [Internet]. 1983;73(1):315-21. doi: https://doi.org/10.1121/1.388812
7. Sapir S. Acoustic and electromyographic analyses of human laryngeal responses to auditory stimulation [Ph.D dissertation]. [Seattle]: University of Washington; 1982.
8. Udaka J, Kanetake H, Kihara H, Koike Y. Human auditory-laryngeal reflex. The Japan Journal of Logopedics and Phoniatrics [Internet]. 1989;30(4):360-7. doi: https://doi.org/10.5112/jjlp.30.360
9. Cantor-Cutiva LC, Codino J, Bottalico P, Hunter EJ, Rubin A, Jackson-Menaldi C. Changes on voice quality after Pure Tone Stimulation. A pilot study. Paper presented at: The Voice Foundation 47th Annual Symposium: Care of the Professional Voice; 2018 May 30-Jun 3; Philadelphia, USA.
10. Hoffmann TC, Glasziou PP, Boutron I, Milne R, Perera R, Moher D, et al. Better reporting of interventions: template for intervention description and replication (TIDieR) checklist and guide. Bmj [Internet]. 2014;348:g1687. doi: https://doi.org/10.1136/bmj.g1687
11. Shrivastav R, Eddins D, Anand S. Pitch strength of normal and dysphonic voices. The J Acoust Soc Am [Internet]. 2012;131(3):2261-9. doi: https://doi.org/10.1121/1.3681937
12. Kopf LM, Jackson-Menaldi C, Rubin AD, Skeffington J, Hunter EJ, Skowronski MD, et al. Pitch strength as an outcome measure for treatment of dysphonia. J Voice [Internet]. 2017;31(6):691-6. doi: https://doi.org/10.1016/j.jvoice.2017.01.016
13. Ferrand CT. Harmonics-to-Noise Ratio: An Index of Vocal Aging. J Voice [Internet]. 2002;16(4):480-7. doi: https://doi.org/10.1016/S0892-1997(02)00123-6
14. Teixeira JP, Fernandes PO. Jitter, Shimmer and HNR Classification within Gender, Tones and Vowels in Healthy Voices. Procedia Technology [Internet]. 2014;16:1228-37. doi: https://doi.org/10.1016/j.protcy.2014.10.138
15. Heman-Ackah YD, Michael DD, Baroody MM, Ostrowski R, Hillenbrand J, Heuer RJ, et al. Cepstral Peak Prominence: A More Reliable Measure of Dysphonia. Ann Otol Rhinol Laryngol [Internet]. 2003;112(4):324-33. doi: https://doi.org/10.1177/000348940311200406
16. Kent RD, Read C. The acoustic analysis of speech. 2nd ed. Albany: Singular/Thomson Learning; 2002. 311 p.
17. Yanagihara N. Significance of harmonic changes and noise components in hoarseness. J Speech Hear Res. 1967;10(3):531-41. doi: https://doi.org/10.1044/jshr.1003.531
18. Titze IR. Workshop on acoustic voice analysis. National Center for Voice and Speech; 1994 Feb. p. 1-36.
19. Sprecher A, Olszewski A, Jiang JJ, Zhang Y. Updating signal typing in voice: addition of type 4 signals. J Acoust Soc Am [Internet]. 2010;127(6):3710-6. doi: https://doi.org/10.1121/1.3397477
20. Bastilha GR, Pagliarin KC, Cielo CA. Development and evidence of content validity of the Spectrographic Vocal Assessment Protocol (SVAP). J Voice [Internet]. 2021;35(4):512-20. doi: https://doi.org/10.1016/j.jvoice.2019.12.008
21. R Development Core Team. The R Project for Statistical Computing [Internet]. Vienna: The R Foundation for Statistical Computing; c2024 [cited 2014 Jan 19]; [about 3 screens]. Available from: https://www.r-project.org/
22. Akaike H. Information theory and an extension of maximum likelihood principle. In Petrov BN, Caski F, editors. Proceeding of the Second International Symposium on Information Theory. Budapest: Akademiai Kiado; 1973. p. 267-81.
23. Bates D, Maechler M, Bolker B, Walker S. lme4: Linear mixed-effects models using ‘Eigen’ and S4 [Internet]. Vienna; The R Foundation for Statistical Computing; c2024 [updated 2024 Jul 3; cited 2016 Sep 23]; [about 3 screens]. doi: https://doi.org/10.32614/CRAN.package.lme4
24. Kuznetsova A, Brockhoff PB, Christensen R. lmerTest: Tests in linear mixed-effects models. [Internet]. Vienna; The R Foundation for Statistical Computing; c2024 [updated 2020 Oct 23; cited 2016 Sep 23]; [about 2 screens]. doi: https://doi.org/10.32614/CRAN.package.lmerTest
25. Hothorn T, Bretz F, Westfall P. multcomp: Simultaneous Inference in General Parametric Models. [Internet]. Vienna; The R Foundation for Statistical Computing; c2024 [updated 2024 Jul 18]; [about 2 screens]. doi: https://doi.org/10.32614/CRAN.package.multcomp
26. Fleiss JL, Cohen J. The equivalence of weighted kappa and the intraclass correlation coefficient as measures of reliability. Educational and psychological measurement [Internet]. 1973;33(3):613-9. doi: https://doi.org/10.1177/001316447303300309
27. Landis JR, Koch GG. The measurement of observer agreement for categorical data. Biometrics [Internet]. 1977;33(1):159-74. doi: https://doi.org/10.2307/2529310
28. Alegria R, Freitas SV, Manso MC. Is there an improvement on acoustic voice parameters in patients with bilateral vocal fold nodules after voice therapy? A meta-analysis. Eur Arch Otorhinolaryngol [Internet]. 2020;277:2163-72. doi: https://doi.org/10.1007/s00405-020-05956-2
29. Nguyen DD, Kenny DT. Randomized controlled trial of vocal function exercises on muscle tension dysphonia in Vietnamese female teachers. J Otolaryngol Head Neck Surg [Internet]. 2009;38(2):261-78. Available from: https://pubmed.ncbi.nlm.nih.gov/19442378/
30. Hofman EC, Dassie-Leite AP, Martins PDN, Pereira EC. Acoustic measurements of CPPS and AVQI pre and post speech therapy. CoDAS [Internet]. 2023;35(6):1-7. doi: https://doi.org/10.1590/2317-1782/20232022136en
31. Tanner K, Roy N, Ash A, Buder EH. Spectral moments of the long-term average spectrum: sensitive indices of voice change after therapy? J Voice [Internet]. 2005;19(2):211-22. doi: https://doi.org/10.1016/j.jvoice.2004.02.005
32. Lee SH, Lee KC, Ban JH, Lee NH, Jin SM. Vocal analysis related to changes in frequency of pure tone auditory feedback. Yonsei Med J [Internet]. 2008;49(4):610-14. doi: https://doi.org/10.3349/ymj.2008.49.4.610
33. Akerlund L. Averages of Sound Pressure Levels and Mean Fundamental Frequencies of Speech in Relation to Phonetograms: Comparison of Nonorganic Dysphoria Patients Before and After Therapy. Acta Otolaryngol [Internet]. 1993;113(1):102-8. doi: https://doi.org/10.3109/00016489309135775
34. Speyer R, Wieneke GH, van Wijck-Warnaar I, Dejonckere PH. Effects of voice therapy on the voice range profiles of dysphonic patients. J Voice [Internet]. 2003;17(4):544-56. doi: https://doi.org/10.1067/S0892-1997(03)00079-1
35. Anand S, Skowronski MD, Shrivastav R, Eddins DA. Perceptual and quantitative assessment of dysphonia across vowel categories. J Voice [Internet]. 2019;33(4):473-81. doi: https://doi.org/10.1016/j.jvoice.2017.12.018
36. Shama K, Krishna A, Cholayya NU. Study of harmonics-to-noise ratio and critical-band energy spectrum of speech as acoustic indicators of laryngeal and voice pathology. EURASIP Journal on Advances in Signal Processing. 2006;2007:1-9.
37. Mansuri B, Torabinezhad F, Jamshidi AA, Dabirmoghadam P, Vasaghi-Gharamaleki B, Ghelichi L. Effects of voice therapy on vocal tract discomfort in muscle tension dysphonia. Iran J Otorhinolaryngol [Internet]. 2019;31(5):297-304. doi: https://doi.org/10.22038/ijorl.2019.36676.2205
38. Chhetri SS, Gautam R. Acoustic analysis before and after voice therapy for laryngeal pathology. Kathmandu Univ Med J (KUMJ) [Internet]. 2015;13(4):323-7. doi: https://doi.org/10.3126/kumj.v13i4.16831
39. Lu D, Chen F, Yang H, Yu R, Zhou Q, Zhang X, et al. Changes after voice therapy in acoustic voice analysis of chinese patients with voice disorders. J Voice [Internet]. 2018;32(3):386.e1-386.e9. doi: https://doi.org/10.1016/j.jvoice.2017.05.005
40. Madill C, Chacon A, Kirby E, Novakovic D, Nguyen DD. Active Ingredients of Voice Therapy for Muscle Tension Voice Disorders: A Retrospective Data Audit. J Clin Med [Internet]. 2021;10(18):1-30. doi: https://doi.org/10.3390/jcm10184135
41. Nasrin S, Ali D, Jamshid J, Hamed G, Bashir R, Hamide G. The effects of cricothyroid visor maneuver (cvm) therapy on the voice characteristics of patients with muscular tension dysphonia: a case series study. J Voice [Internet]. 2024;38(5):1250.e1-1250.e9. doi: https://doi.org/10.1016/j.jvoice.2022.02.016
42. Baken RJ, Orlikoff RF. Clinical measurement of speech and voice. 2nd ed. San Diego: Singular Thomson Learning; 2000. 610 p.
43. Jackson-Menaldi MCA. La voz normal y patológica. diagnóstico y tratamiento de la patología vocal. 1st ed. Buenos Aires: Editorial Médica Panamericana; 2019. 536 p.