
Beyond Role Conflict and Ambiguity: A Global Measure of Role Stress among South African School Teachers
Más allá del conflicto y la ambigüedad de roles: una medida global del estrés de rol entre los profesores sudafricanos
Abstract
Background: Role stress is linked to reduced work performance, diminished organizational commitment, increased intention to leave a job, and negative physical and mental health effects. Given the significant implications of role stress, researchers have sought to understand and quantify the concept. The Role Conflict and Ambiguity (RCA) scales are widely utilized in job stress research as the predominant measurement tools. They were originally conceptualized as consisting of two independent dimensions: role conflict and role ambiguity.
Objective: This study advances the validation research of the RCA scales by exploring its dimensionality through Mokken Scale Analysis (MSA) and Classical Test Theory (CTT).
Method: South African school teachers responded to the RCA scales, Maslach Burnout Inventory, and Teaching Satisfaction Scale. Confirmatory Factor Analysis (CFA) and MSA were employed for data analysis.
Results: The research determined that a second-order model provided the optimal fit, indicating that role ambiguity and role conflict are subordinate dimensions within the overarching construct of role stress.
Conclusion: The findings from the CFA and supplementary bifactor indices reinforce the view that the instrument comprises 13 items, which assess a general dimension of role stress along with two sub-dimensions: role conflict and role ambiguity. Such specificity may lead to more effective strategies to mitigate role-related stress, thereby enhancing overall employee well-being, job satisfaction, and organizational productivity.
Keywords
Ancillary bifactor indices; classical test theory; confirmatory factor analysis; Mokken scale analysis; role ambiguity; role stress; role conflict.
Resumen
Antecedentes: El estrés de rol está relacionado con la reducción del rendimiento laboral, la disminución del compromiso organizativo, el aumento de la intención de abandonar el trabajo y los efectos negativos sobre la salud física y mental. Dadas las importantes implicaciones del estrés de rol, los investigadores han tratado de comprender y cuantificar este concepto. Las escalas de Conflicto y Ambigüedad de Roles (RCA) se utilizan ampliamente en la investigación del estrés laboral como herramientas de medición predominantes. Al principio, se conceptualizaron como dos dimensiones independientes: conflicto de rol y ambigüedad de rol.
Objetivo: Este estudio avanza en la investigación de validación de las escalas RCA, explorando su dimensionalidad mediante el Análisis de Escalas de Mokken (MSA) y la Teoría Clásica de los Test (CTT).
Método:. Profesores sudafricanos respondieron a las escalas RCA, Maslach Burnout Inventory y Teaching Satisfaction Scale. Se emplearon el Análisis Factorial Confirmatorio (AFC) y el MSA para el análisis de los datos.
Resultados: La investigación determinó que un modelo de segundo orden proporcionaba el ajuste óptimo, indicando que la ambigüedad de rol y el conflicto de rol son dimensiones subordinadas dentro del constructo global del estrés de rol.
Conclusiones: Los resultados del AFC y los índices bifactoriales suplementarios refuerzan la opinión de que el instrumento consta de 13 ítems, que evalúan una dimensión general de estrés de rol junto con dos subdimensiones: conflicto de rol y ambigüedad de rol. Esta especificidad puede conducir a estrategias más eficaces para mitigar el estrés relacionado con el rol, mejorando así el bienestar general de los empleados, la satisfacción en el trabajo y la productividad de la organización.
Palabras clave
Índices bifactoriales auxiliares; teoría clásica del test; análisis factorial confirmatorio; análisis de escala de Mokken; ambigüedad de rol; estrés de rol; conflicto de rol.
Introduction
Occupational stress is a prevalent issue in modern workplaces that emerges from the complex interplay between the individual's internal characteristics (e.g., emotional intelligence and resilience) and external (e.g., organizational culture) resources and their occupational environment [1]. Role stress is a central feature of work-related stress that typically arises when there is a mismatch between what is expected of an individual in their role and what the individual perceives or understands those expectations to be. In the current study, we specifically concentrate on two central dimensions of role stress: role ambiguity and role conflict. This focus is guided by the theoretical underpinnings of role identity theory, which emphasizes the alignment of individual role perceptions with organizational expectations. Role ambiguity, characterized by unclear or insufficient information about role expectations [2], and role conflict, arising from incompatible demands within a role, are pivotal in understanding the dynamics of work-related stress [2]. By concentrating on these dimensions, our study aims to provide a nuanced understanding of how discrepancies in role expectations and perceptions contribute to stress.
The concept of role stress can be conceptualized within the framework of role identity theory, which proposes that a significant component of an individual's self-concept or identity is defined by the roles (e.g., parent or employee) they occupy [3,4]. Individuals’ roles are associated with specific expectations, behaviors, and norms that shape how individuals view themselves and how they are perceived by others. Over time, individuals may internalize the expectations and norms associated with a role as a fundamental part of their identity. Within the workplace, this internalization of roles can lead to organizational commitment, enhance productivity, and lower role stress. For example, Sun and colleagues [5] reported that nursing students possessing a stronger sense of professional identity experienced reduced role stress. Similarly, Chinese university teachers [6] experiencing a stronger sense of professional identity experienced reduced burnout and greater job satisfaction.
Role stress is linked to various detrimental effects, such as decreased work performance, reduced commitment to the organization, increased likelihood of leaving the job, and negative impacts on both physical and mental health [7]. Depression and anxiety are the psychiatric disorders most associated with job stress [8]. The COVID-19 disease outbreak has dramatically altered the workplace landscape, creating unprecedented challenges that have intensified role stress for many individuals. As organizations rapidly adapted to remote working arrangements, new health protocols, and fluctuating economic conditions, clear communication about roles and expectations was often lacking or compromised.
For frontline workers, conflicting demands related to safety and service exacerbated role stress. This increased role stress has been observed in studies conducted among nurses [9], teachers [10], and employees in the tourism and hospitality sector [11]. For instance, healthcare professionals like nurses and physicians had to offer critical care to a growing number of patients impacted by the virus. This situation demonstrated their dedication to service, yet it also posed substantial risks to their own health and well-being [12,13]. This situation may have led to role conflict as healthcare workers balanced their dedication to patient care with their responsibility to protect themselves and their families [14].
Similarly, school teachers faced a unique set of challenges during the COVID-19 pandemic, often resulting in role stress. In the context of the COVID-19 related prevention measures, teachers had to rapidly adapt to new technologies and teaching methods while striving to maintain educational standards and support their students' emotional well-being [15,16]. These demands contributed to role conflict as teachers had to manage the work demands of providing quality education along with their worries about their wellbeing, technological limitations, and students learning needs. Further, the constantly changing governmental guidelines, expectations, and methods of instruction introduced a significant degree of role ambiguity, leaving teachers uncertain about their responsibilities and the most effective ways to fulfill them [17].
Given the significant implications of role stress for health, well-being, and job satisfaction, researchers have sought to understand and quantify role stress through the creation of measurement tools. The role conflict and ambiguity (RCA) scales [2] are the most extensively used scales in research regarding job stress [18]. Much of the criticism has centered on the instruments’ factor structure and the potential for confusion in the measured construct, stemming from the way the items are phrased. In the role conflict scale, items receive positive scoring, whereas in the role ambiguity scale, all items are scored in reverse. This difference in scoring methods may create confusion when interpreting outcomes and could potentially affect the scales' reliability and the validity of the constructs they measure. Such inconsistencies in terms of scoring can cause confusion in factor analysis, thereby challenging the integrity of the measurement [18].
The majority of studies providing support for the scales [19-21] and critiquing their factor structure were completed decades ago [18,22,23]. Recent research has utilized both exploratory and confirmatory factor analysis, along with goodness-of-fit indices. These studies have identified a three-factor model as suitable for role conflict and a two-factor model as appropriate for role ambiguity [24,25]. To potentially address the ongoing debate over the validity of the RCA scales and the uncertainties about its factor structure, this study aims to examine the instrument's dimensionality through Mokken Scale Analysis (MSA) and Classical Test Theory (CTT), specifically within a cohort of South African school teachers. The RCA scales have been presented as two independent scales [2], and we hypothesize that these scales are reflective of a higher-order construct of job-related stress. Utilizing MSA provides a non-parametric method for assessing the hierarchy and scalability of items, while CTT offers further insight on the scales' reliability and validity. Combined, these methodologies enhance the comprehension of the RCA scales, offering a more detailed and nuanced analysis.
In addition to exploring the dimensionality of the RCA scales, this study incorporates the measurement of burnout and teacher satisfaction as criterion variables. The rationale behind this selection is twofold. Firstly, burnout is a critical variable in the study of job-related stress, particularly in teaching professions [26,27]. It represents the culmination of prolonged exposure to chronic occupational stress, of which role conflict and ambiguity are significant components. By assessing burnout, we aim to establish a direct link between the outcomes measured by the RCA scales and their impact on teachers' occupational health and well-being. Secondly, teacher satisfaction is included as it is a key indicator of job fulfillment and overall professional contentment [16]. Satisfaction in the workplace is often inversely related to the levels of role stress experienced by individuals. By measuring both burnout and satisfaction, we seek to provide a comprehensive understanding of how role stress, as quantified by the RCA scales, correlates with these critical aspects of occupational health and job satisfaction. These variables, therefore, are not only relevant to the psychometric validation of the RCA scales but also pivotal in understanding the broader implications of role stress in educational settings. Including these variables potentially generates a more comprehensive picture of the impact of role stress on key outcomes in the teaching profession, thereby enriching the study's contributions to both theoretical frameworks and practical applications in educational settings
Materials and methods
Participants
The study's participants were a convenience sample of 355 school teachers in South Africa. An online version of the questionnaires, outlined in the Instruments section, was created using Google Forms. Subsequently, permission was obtained to share the link to these forms in teacher-centric Facebook groups, facilitated by their group administrators. Data collection occurred between April and July 2021.
Most participants in the sample were female (76.9%), residing in urban areas (61.7%), employed in public schools (88.2%), and worked as primary school teachers (61.1%). The average age of the teachers in the study was 41.89 years (SD = 12.42), and they had an average teaching experience of 15.70 years (SD = 11.75). Due to privacy legislation in South Africa, we were unable to access national databases for the purpose of random sampling. Nonetheless, we aligned our study's sample with demographic data from an international survey on teaching and learning [28]. This survey showed that in South Africa, 60% of teachers are female, with an average teaching experience of 15 years and a mean age of 43 years. Statistical analyses using Chi-squared and one-sample t-tests revealed no significant differences between our sample and the broader teacher population regarding gender (χ² = 0.06, p > .05), years of teaching experience (t = 1.11, p > .05), or age (t = 1.68, p > .05).
Instruments
The participants in the study filled out several questionnaires: the RCA scales, the Maslach Burnout Inventory - MBI [29], and the Teaching Satisfaction Scale -TSS [30]. Additionally, they provided demographic information through a concise demographic survey.
The RCA scales are comprised of 14 items, with eight dedicated to measuring role conflict and six for role ambiguity. For instance, a role conflict item is “I have to do things that should be done differently,” while a role ambiguity item is “I know what my responsibilities are.” Participants rate these 14 items on a six-point scale, where 1 signifies definitely not true of my job and 6 definitely true of my job. Rizzo and colleagues reported reliability coefficients of .82 for role conflict and .87 for role ambiguity. Furthermore, the validity of the scale is supported by the correlation between role conflict and role ambiguity with job satisfaction, as well as the intention to leave, indicating the effectiveness of these scales in measuring the intended constructs [2]. Given the different scoring directions of the role conflict and role ambiguity scales, participants were provided with explicit instructions to ensure they were aware of the scoring direction of each item. This step was intended to minimize confusion and encourage attentive responses. In our data analysis process, we conducted thorough data cleaning and consistency checks. This included identifying and addressing any patterns of response that suggested confusion or misinterpretation of the item scoring.
The MBI is a prominent tool for measuring burnout and includes 22 items that evaluate three key aspects: emotional exhaustion, depersonalization, and personal accomplishment. Emotional exhaustion, the central element of burnout, assesses feelings of fatigue and emotional depletion from work. For instance, an item representing this dimension is “I feel like my work is breaking me down.” Depersonalization is characterized by a detached or indifferent attitude towards learners and colleagues, exemplified by the item “I feel I treat my team/colleagues impersonally, like they are objects.” The dimension of personal accomplishment focuses on the sense of efficacy and achievement in one's work, as illustrated by the item “I accomplish many worthwhile things in this job.” Responses to these 22 items are recorded on a scale from 0 (Never) to 6 (Every day). In their initial research, the creators of the MBI documented reliability coefficients between .69 and .92, and demonstrated the scale’s validity [29].
The TSS evaluates teachers' subjective assessments of their job satisfaction. This scale is composed of five items, and participants rate their responses on a five-point scale ranging from 1 (strongly disagree) to 5 (strongly agree). An example item from the TSS is “In most ways, being a teacher is close to my ideal.” In the initial study developing this scale, the authors reported a Cronbach’s alpha of .77, indicating good internal consistency. The scale's validity is further supported by significant correlations between TSS scores and other established measures of job satisfaction, as well as indices of teacher stress and psychological distress [30].
Ethics
Ethical clearance for this research was granted by the Humanities and Social Sciences Ethics Committee at the University of the Western Cape, under the reference number HS21/3/8. The study adhered to the principles outlined in the Declaration of Helsinki Guidelines. Participation in the study was entirely voluntary and maintained participant anonymity. Informed consent was acquired from participants through the initial page of the electronic survey link.
Data Analysis
In our study, the monotone homogeneity model (MHM) of Mokken Scale Analysis (MSA) was employed to assess the dimensionality of the RCA scales. The MHM operates under two fundamental assumptions: unidimensionality and monotonicity. To explore an instrument's dimensionality, MSA utilizes an algorithm known as the automated item selection procedure (AISP). This approach yields a value of zero for items that are unscalable, meaning they do not align with any scale, and it determines whether items are associated with a single scale or multiple scales. The principle of monotonicity within this context suggests that the likelihood of an item being endorsed escalates as the underlying latent variable's value rises. MSA identifies violations of this assumption and uses a Crit value to indicate the seriousness of the violation. In general, Crit values lower than 80 are considered minor and acceptable [31].
MSA calculates the overall robustness of a scale using an 'H coefficient', and an individual 'Hi' coefficient for each item. These indices gauge how well each item measures the underlying latent variable. H coefficients below .40 signify a weak scale, those ranging from .40 to .50 indicate a medium scale, and values above .50 denote a strong scale [32]. Mokken posits that Hi coefficients exceeding .30 suggest items effectively fit the measurement of the latent variable [33]. MSA also yields an estimate of internal consistency, known as MSrho. These MSA indices were derived using the “Mokken” package [34] in R [35].
For evaluating each item's contribution to measuring the latent variable from a classical test theory perspective, IBM SPSS for Windows version 28 (IBM Corp., Armonk, NY, USA) was utilized to ascertain item-total correlations. Correlations above .50 signify a substantial contribution of an item to the overall scale measurement [36]. SPSS also facilitated the acquisition of descriptive statistics (means and standard deviations) for individual items and the total scale, estimates of internal consistency (Cronbach’s alpha), and inter-variable correlations. The inclusion of burnout and job satisfaction measures aimed to verify the criterion-related validity of the RCA scales. In addition, SPSS was used to obtain descriptive statistics (means and SDs) for individual items and the total scale, estimates of internal consistency (Cronbach’s alpha), and correlations between variables. Measures of burnout and job satisfaction were included to determine the criterion-related validity of the RCA scales.
The structural composition of the RCA scales was analyzed through Confirmatory Factor Analysis (CFA) with maximum likelihood estimation, utilizing IBM Amos for Windows (IBM Corp., Armonk, NY, USA). Three distinct models regarding the RCA scales' potential factor structure were explored: a two-factor model with correlated factors, a bifactor model featuring one general and two specific factors, and a hierarchical second-order model where items are linked to two subscales, which then contribute to a total scale. To evaluate model fit, various indices were considered, including the Tucker-Lewis index (TLI), chi-square (χ²), the goodness-of-fit index (GFI), the root-mean-square error of approximation (RMSEA) and the confirmatory fit index (CFI). Generally, a model is considered to have a good fit if it exhibits a non-significant χ², a GFI over .95, CFI and TLI values above .90, and an RMSEA below .08. A non-significant chi-square (χ²) value suggests an ideal model fit [37]. Furthermore, Akaike’s Information Criterion (AIC), used for model comparison, was also incorporated into the analysis. A model is deemed to have a better fit if it has a lower AIC value.
To assess the variance in items explained by the total scale and its subscales, ancilliary bifactor indices were employed. For this purpose, an online Excel spreadsheet [38] was utilized to compute key metrics including Omega Hierarchical (ωH), Explained Common Variance (ECV), Omega (ω) and the Construct Replicability Coefficient (H).
ECV represents the percentage of variance in all items that is explained by both the total scale and its subscales. Omega (ω) provides a model-based estimation of reliability, Omega Hierarchical (ωH) measures the systematic variance in items when the variance accounted for by the total scale is removed, and the Construct Replicability Coefficient is an indicator of the reliability in measuring the latent variables. It has been suggested that an ECV of the total scale that is greater than .70 [39] indicates the subscales do not account for a sufficient amount of variance to be considered meaningful dimensions. Further, a construct with a replicability coefficient greater than .80 and ωH greater than .80 is considered reflective of a well-defined latent trait [40].
Results
Table 1 presents the item-level indices derived from MSA and CTT.
Table 1. Mokken Scale Analysis and Classical Test Theory Indices for the Items of the Role Questionnaire.
| Item | AISP | Crit | H i | ITC | Mean | SD |
|---|---|---|---|---|---|---|
| Role ambiguity | ||||||
| 1. Know what is expected | 1 | 0 | .53 | .68*** | 2.25 | 1.28 |
| 2. Clear planned goals exist | 1 | 0 | .52 | .67*** | 2.43 | 1.35 |
| 3. Divided time properly | 1 | 9 | .40 | .49*** | 2.75 | 1.37 |
| 4. Know what responsibilities are | 1 | 0 | .54 | .65*** | 1.94 | 1.01 |
| 5. Explanation is clear of what has to be done | 1 | 7 | .46 | .57*** | 2.55 | 1.26 |
| 6. Certain about level of authority | 1 | 16 | .45 | .56*** | 2.81 | 1.40 |
| Role conflict | ||||||
| 7. Have to do things that should be done differently | 2 | 0 | .41 | .57*** | 4.09 | 1.46 |
| 8. Have to work on unnecessary things | 2 | 0 | .38 | .53*** | 3.91 | 1.60 |
| 9. Receive assignment with no manpower support | 2 | 8 | .41 | .59*** | 3.68 | 1.55 |
| 10. Receive assignment without adequate resources | 2 | 0 | .44 | .63*** | 3.64 | 1.67 |
| 11. Have to buck a policy to carry out assignment | 2 | 0 | .28 | .47*** | 3.62 | 1.55 |
| 12. Receive incompatible requests | 2 | 0 | .33 | .61*** | 3.54 | 1.43 |
| 13. Do things that are accepted by one and not by other | 2 | 0 | .43 | .59*** | 3.63 | 1.51 |
| 14. Work with different groups that operate differently | 0 | 0 | .41 | .37*** | 4.26 | 1.49 |
Note. AISP = automated item selection procedure; Crit = Crit value for monotonicity; H i = scalability coefficient for individual items; ITC = item-total correlation. *** p < .001
Initially, AISP in MSA was applied to assess the dimensionality of the RCA scales. As demonstrated in Table 1, AISP revealed that the items of the RCA scales aligned with two distinct scales, correlating with role ambiguity and role conflict respectively. However, AISP also identified that item 14 (“I work with two or more groups who operate quite differently”) was unscalable and did not load on any scale. Item 14 was therefore excluded from further analysis. The H coefficients for each item (H) on the role ambiguity scale all exceeded 0.30, with values ranging between .40 and .54. Similarly, the H i coefficients for the role conflict scale ranged from .33-.44, except for item 14 which was lower than .30. For the role conflict and role ambiguity dimensions, the overall H coefficient reflected a medium scale (ambiguity: .48; conflict: .42). For the role ambiguity scale, three notable instances of monotonicity violations were observed, yet the corresponding Crit values for these infractions were below 80, specifically 9, 7, and 16. For the role conflict scale, one significant violation of monotonicity was observed, but the associated Crit value was 8. Thus, the assumption of monotonicity was met for both scales. The MSrho was also satisfactory for both scales (role conflict: MSrho = 0.83; role ambiguity: MSrho = 0.83).
In terms of CTT, item-total correlations varied between .49 and .68 for the role ambiguity scale. For the role conflict scale, these correlations spanned from .46 to .63, with item 14 being an exception. All item-total correlations were statistically significant, indicating that every item effectively contributed to measuring the two latent constructs. On each scale, one item fell marginally below the .50 threshold, while item 14 showed a notably lower correlation, substantially under .50.
To investigate if the two scales collectively measure overall stress, we employed CFA to contrast three models of the RCA scales' factor structure: a model with two correlated factors, a bifactor model encompassing one general factor along with two specific factors, and a hierarchical second-order model where two subscales serve as first-order factors and role stress functions as a second-order factor. We excluded item 14 from the analysis based on the AISP, Hi coefficient, and low item-total correlation. Figure 1 presents the three models.
Figure 1. Three Models of the Factor Structure of the Role Questionnaire
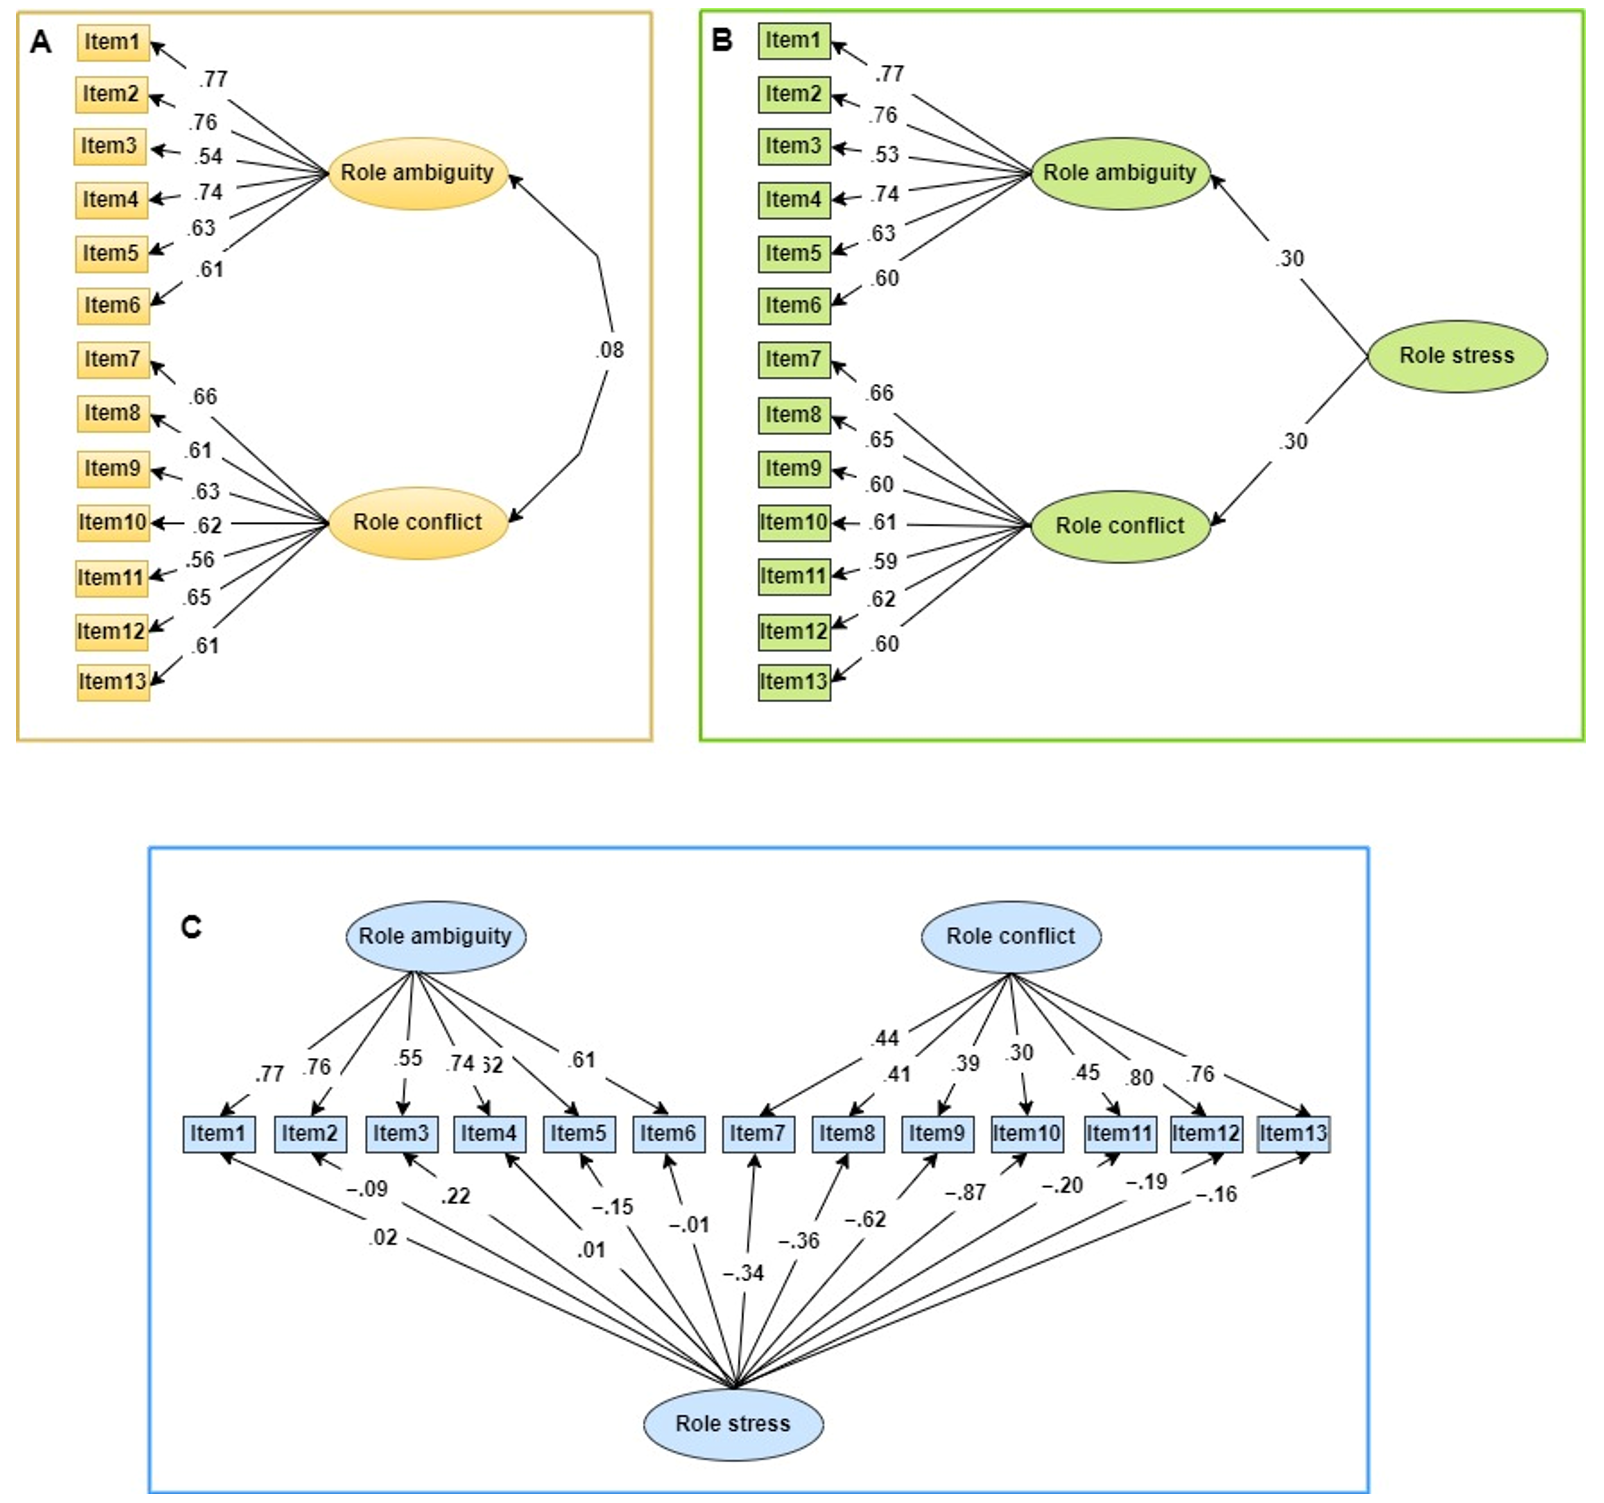
Note. A = correlated two-factor model; B = hierarchical second-order model; C = bifactor model. Rectangles are observed measurements, ellipses are latent variables. All regression coefficients are standardized.
Table 2 displays the fit indices from the CFA. These indices suggest that all three models adequately fit the data, meeting standard thresholds (GFI ≥ .95, TLI > .90, CFI > .90, RMSEA < .08). Based on the AIC as a model comparison index, the second-order hierarchical model emerges as the best fitting one.
Table 2. CFA Fit Indices for Three Models of the Factor Structure of the Role Questionnaire.
| Fit index | Good fit criteria | Correlated two-factor | Bifactor | Second-order factor |
|---|---|---|---|---|
| X2(df) | 113.95 (57) | 88.39 (47) | 94.05 (54) | |
| p-value | Nonsignificant | < .001 | < .001 | < .001 |
| GFI | > .95 | .95 | .97 | .96 |
| TLI | > .90 | .95 | .96 | .96 |
| CFI | > .90 | .97 | .97 | .98 |
| RMSEA [90% CI] | < .08 | .05 [.04, .07] | .06 [.03, .07] | .05 [.03, .06] |
| AIC | Lower levels | 181.95 | 176.39 | 168.05 |
Note. X2 = chi-square statistic; GFI = goodness-of-fit index; TLI = Tucker-Lewis index; CFI = comparative fit index; RMSEA = root-mean-square error of approximation; AIC = Akaike information criterion.
Figure 1 shows that in the correlated two-factor model, factor loadings varied from .54 to .77, with all being statistically significant (p < .001). Yet, the correlation between the two factors was not significant. In the hierarchical model, factor loadings spanned from .53 to .77, all significant as well. The loading from the first-order factor onto the second-order factor was also significant. However, in the bifactor model, several factor loadings for the general factor were negative. The ancillary bifactor indices for this bifactor model are detailed in Table 3.
Table 3. Ancillary Bifactor Indices for the Role Questionnaire.
| Factor | ECV | Omega | OmegaH | H |
|---|---|---|---|---|
| General factor - role stress | .25 | .83 | .20 | .82 |
| Specific factor - role ambiguity | .44 | .84 | .84 | .85 |
| Specific factor - role conflict | .32 | .85 | .53 | .80 |
Note. ECV = explained common variance; H = construct replicability coefficient.
Table 3 shows that the construct replicability coefficient H was higher than or equal to .80, implying that all three factors constitute a well-constituted latent variable. The model-based estimate of reliability ω indicates that all three factors demonstrated satisfactory reliability (ω > .80). Table 3 reveals that the general factor is responsible for 25% of the reliable variance in the items, whereas the two specific factors accounted for 44% and 32%, respectively, of the variance in items. Taking into account the variance attributed to the general factor, the ωH values show that role ambiguity and role conflict contributed to 84% and 53% of the item variance, respectively.
The summary statistics and intercorrelations between variables as well as the reliabilities of scales are detailed in Table 4.
Table 4. Intercorrelations, Descriptive Statistics, and Reliabilities of Study Variables.
| Variables and indices | 1 | 2 | 3 | 4 | 5 | 6 | 7 |
|---|---|---|---|---|---|---|---|
| 1. Role stress | |||||||
| 2. Role conflict | .83*** | ||||||
| 3. Role ambiguity | .59 | .04 | |||||
| 4. Teaching satisfaction | −.36*** | −.19*** | −.38*** | ||||
| 5. Emotional exhaustion | .46*** | .38*** | .27*** | −.48*** | |||
| 6. Depersonalization | .49*** | .40*** | .29*** | −.36*** | .71*** | ||
| 7. Personal accomplishment | −.32*** | −.04 | −.51 | .42*** | −.31*** | −.34 | |
| Mean | 45.09 | 30.36 | 14.73 | 17.26 | 19.84 | 12.64 | 31.99 |
| SD | 10.14 | 8.21 | 5.65 | 4.66 | 11.97 | 10.26 | 11.01 |
| Alpha | .78 | .83 | .83. | .87 | .94 | .85 | .84 |
Note. *** p < .001
Table 4 shows that the reliabilities of all scales can be considered satisfactory (α: .78-.94). Role stress has a significantly negative correlation with teaching satisfaction (r = −.36, p < .001, medium effect size) and personal accomplishment (r = −.32, p < .001, medium effect size). Conversely, a significant positive relationship between role stress and both emotional exhaustion (r = .46, p < .001, medium effect size) and depersonalization (r = .49, p < .001, medium effect size) was evident. Apart from a non-significant negative link between role conflict and personal accomplishment, role conflict and role ambiguity showed similar patterns of association with all criterion variables. These results suggest that elevated levels of role stress, role conflict, and role ambiguity correlate with lower teaching satisfaction, while these same factors are associated with higher instances of emotional exhaustion and depersonalization. Moreover, increased levels of role stress and role ambiguity are linked to a diminished personal accomplishment.
Discussion
Since the development of the Rizzo and colleagues [2] RCA scales, many scholars have debated the factor structure of the scales [23,24]. Most of the studies investigating the properties of the scales relied on EFA, CFA, and goodness-of-fit indices and were conducted several decades ago [18,19]. The RCA scales have historically been conceptualized as comprising two independent scales namely, role conflict and role ambiguity. This study contributes to the research base in this area by examining the dimensionality of the RCA scales using MSA and CTT to determine whether these two independent scales are reflective of a higher-order construct of job-related stress.
AISP in MSA showed that the 14 items of the instrument aligned with two distinct scales, representing role conflict and role ambiguity. Nonetheless, one item was found to be unscalable and therefore excluded from subsequent analyses. The Hi coefficients and item-total correlations confirmed that each item on the scales effectively contributed to assessing role conflict and role ambiguity. This provides robust support for the construct validity of the two scales.
CFA indicated acceptable fit indices for a bifactor model, a correlated two-factor model, and a second-order hierarchical model. However, based on the model comparison index, the second-order hierarchical model demonstrated the most suitable fit. This implies that role ambiguity and role conflict are better viewed as sub-dimensions within the higher-order construct of role stress. The outcomes of the CFA, along with the ancillary bifactor indices, lend support to the idea that the instrument comprises 13-items that effectively measures a global role stress dimension, in addition to the two specific subscales of role conflict and role ambiguity. Moreover, the reliability of the overall scale and both subscales was found to be satisfactory.
The associations between role stress, role conflict, and role ambiguity, alongside the dimensions of burnout and teaching satisfaction, demonstrate criterion-related validity. The results reveal a pattern where elevated levels of role stress, role conflict, and role ambiguity correlate with reduced teaching satisfaction, as well as increased emotional exhaustion and depersonalization. The relationships between role stress, role conflict, and role ambiguity, as well as the dimensions of burnout and teaching satisfaction, serve as evidence of criterion-related validity. The findings indicate that high levels of role stress, role conflict, and role ambiguity are related to low levels of teaching satisfaction and heightened emotional exhaustion and depersonalization. Moreover, greater role stress and role ambiguity are related to a reduced sense of personal accomplishment. This finding is supported by the existing literature. For example, Yaacob and Long [41] reported that role stress, particularly role ambiguity, were predictive of job satisfaction for Malaccan school teachers. Teachers’ lack of clarity and direction needed to perform their role functions contributed to feelings of helplessness and reduced job satisfaction. Research on physical education teachers in the United States [42] reported that role conflict and role ambiguity predicted emotional exhaustion and decreased job satisfaction. Emotional exhaustion was also found to significantly mediate the relationship between work-related stressors and job satisfaction [42]. Research involving university teachers in China [43] identified a partial link between role conflict and burnout, noting that role conflict was related to teachers' experience of depersonalization and emotional exhaustion.
Overall, this study offers further insights into the dimensionality of the RCA scales. The study also highlights the importance of considering the broader construct of role stress, which encompasses both role ambiguity and role conflict. These results are significant for comprehending and addressing role-related stress in teachers. They can inform the development of interventions designed to alleviate the impact of these particular stressors. By tailoring support systems and implementing targeted strategies that address the underlying causes of role ambiguity and role conflict, policymakers can foster a more positive and supportive work environment for teachers. This, in turn, may lead to increased job satisfaction, enhanced teaching effectiveness, and, ultimately, more productive and nurturing educational settings. The results underscore the importance of a comprehensive approach to studying and addressing role stress. However, further research is warranted to refine the measurement of role stress, especially regarding the scale items for which the loading on the latent variable was less than optimal.
The study has certain limitations. While the use of social networks for the distribution and collection of our survey instruments enabled us to reach a broad and diverse sample of teachers, especially given the logistical constraints of the COVID-19 pandemic, it also introduces potential biases that must be considered when interpreting our results. Specifically, the use of social networks may lead to a self-selection bias, where participants who are more active on these platforms and possibly more technology-savvy or engaged with professional development opportunities are overrepresented. This aspect could affect the generalizability of our findings to the wider population of school teachers. Furthermore, the lack of control over the environment in which participants completed the survey could result in varying degrees of attention and seriousness given to the questionnaire. While we have taken steps to mitigate these issues, such as implementing rigorous response validation checks and comparing our sample to national demographics, the limitations inherent in our data collection method must be carefully considered. Furthermore, the reliance on self-reported measures may have led to common method bias, and future research could benefit from incorporating other forms of assessment. Owing to the cross-sectional nature of the data, conclusion about causality need to be made with caution. Longitudinal studies would be beneficial in corroborating the findings. The study’s sample was drawn from a single region and predominantly comprised women, which limits the generalizability of the study findings. Future studies using more diverse samples are recommended. Extraneous variables, such as the participants length of time in the teaching profession and their specific work areas, may have influenced the results, and the potential impact of these variables was not fully explored in this study. Finally, the study did not control for individual differences (e.g., personality traits) which may influence role stress as well as role conflict, and role ambiguity.
Conclusion
This research contributes to the existing knowledge on the factor structure of the RCA scales through the use of MSA and Classical Test Theory CTT. It was determined that the hierarchical second-order model provided the most accurate fit, indicating that role ambiguity and role conflict function as subdimensions within the broader construct of role stress. The outcomes from the CFA and the ancillary bifactor indices affirm the notion that the instrument, comprising 13 items, measures an overarching role stress dimension alongside two specific subscales for role conflict and role ambiguity. Future studies should aim to further validate these scales and assess their practicality, which could lead to more effective approaches for improving well-being and productivity in the workplace.
References
1. Zhang Y, Crant JM, Weng Q. Role stressors and counterproductive work behavior: The role of negative affect and proactive personality. Int J Sel. Assess [Internet]. 2019;27(3):267-79. doi: https://doi.org/10.1111/ijsa.12255
2. Rizzo JR, House RJ, Lirtzman SI. Role Conflict and Ambiguity in Complex Organizations. Adm Sci Q [Internet]. 1970;15(2):150-63. doi: https://doi.org/10.2307/2391486
3. Fitzgerald A. Professional identity: A concept analysis. Nurs Forum [Internet]. 2020;55(3):447-72. doi: https://doi.org/10.1111/nuf.12450
4. Biddle BJ. Recent Developments in Role Theory. Annu Rev Sociol [Internet]. 1986;12(1):67-92. doi: https://doi.org/10.1146/annurev.so.12.080186.000435
5. Sun L, Gao Y, Yang J, Zang X-Y, Wang Y-G. The impact of professional identity on role stress in nursing students: A cross-sectional study. Int J Nurs Stud [Internet]. 2016;63:1-8. doi: https://doi.org/10.1016/j.ijnurstu.2016.08.010
6. Chen H, Liu F, Pang L, Liu F, Fang T, Wen Y, et al. Are You Tired of Working amid the Pandemic? The Role of Professional Identity and Job Satisfaction against Job Burnout. Int J Environ Res Public Health [Internet]. 2020;17(24):1-14. doi: https://doi.org/10.3390/ijerph17249188
7. Yang S, Qiu Y, He J. Meta-analysis of the impact of role stress on the turnover intention of medical staff in tertiary hospitals. Ann Palliat Med [Internet]. 2021;10(1):469-78. doi: https://doi.org/10.21037/apm-20-2446
8. Salari N, Khazaie H, Hosseinian-Far A, Khaledi-Paveh B, Kazeminia M, Mohammadi M, et al. The prevalence of stress, anxiety and depression within front-line healthcare workers caring for COVID-19 patients: a systematic review and meta-regression. Hum Resour Health [Internet]. 2020;18(1):100-14. doi: https://doi.org/10.1186/s12960-020-00544-1
9. Sarboozi Hoseinabadi T, Kakhki S, Teimori G, Nayyeri S. Burnout and its influencing factors between frontline nurses and nurses from other wards during the outbreak of Coronavirus Disease -COVID-19- in Iran. Invest Educ Enferm [Internet]. 2020;38(2). doi: https://doi.org/10.17533/udea.iee.v38n2e03
10. Herman KC, Sebastian J, Reinke WM, Huang FL. Individual and school predictors of teacher stress, coping, and wellness during the COVID-19 pandemic. Sch Psychol [Internet]. 2021;36(6):483-93. doi: https://doi.org/10.1037/spq0000456
11. Kang S-E, Park C, Lee C-K, Lee S. The Stress-Induced Impact of COVID-19 on Tourism and Hospitality Workers. Sustainability [Internet]. 2021;13(3):1-17. doi: https://doi.org/10.3390/su13031327
12. Yıldırım M, Arslan G, Özaslan A. Perceived Risk and Mental Health Problems among Healthcare Professionals during COVID-19 Pandemic: Exploring the Mediating Effects of Resilience and Coronavirus Fear. Int J Ment Health Addict [Internet]. 2022;20(2):1035-45. doi: https://doi.org/10.1007/s11469-020-00424-8
13. Shahrour G, Dardas LA. Acute stress disorder, coping self‐efficacy and subsequent psychological distress among nurses amid COVID‐19. J Nurs Manag [Internet]. 2020;28(7):1686-95. doi: https://doi.org/10.1111/jonm.13124
14. Gupta S, Sahoo S. Pandemic and mental health of the front-line healthcare workers: a review and implications in the Indian context amidst COVID-19. Gen Psychiatr [Internet]. 2020;33(5):e100284-e. doi: https://doi.org/10.1136/gpsych-2020-100284
15. Khlaif ZN, Salha S, Affouneh S, Rashed H, ElKimishy LA. The Covid-19 epidemic: teachers’ responses to school closure in developing countries. Technol Pedagogy Educ [Internet]. 2021;30(1):95-109. doi: https://doi.org/10.1080/1475939X.2020.1851752
16. Padmanabhanunni A, Pretorius T. “I Teach, Therefore I Am”: The Serial Relationship between Perceived Vulnerability to Disease, Fear of COVID-19, Teacher Identification and Teacher Satisfaction. Int J Env Res Public Health [Internet]. 2021;18(24):1-9. doi: https://doi.org/10.3390/ijerph182413243
17. Zang N, Cao H, Zhou N, Jiang L, Li B. Job load, job stress, and job exhaustion among Chinese junior middle school teachers: Job satisfaction as a mediator and teacher’s role as a moderator. Soc Psychol Educ [Internet]. 2022:1-28:1003-30. doi: https://doi.org/10.1007/s11218-022-09719-1
18. King LA, King DW. Role Conflict and Role Ambiguity: A Critical Assessment of Construct Validity. Psychol Bull [Internet].1990;107(1):48-64. doi: https://doi.org/10.1037/0033-2909.107.1.48
19. House RJ, Schuler RS, Levanoni E. Role conflict and ambiguity scales: Reality or artifacts? J Appl Psychol [Internet]. 1983;68(2):334-7. doi: https://doi.org/10.1037/0021-9010.68.2.334
20. Netemeyer RG, Johnston MW, Burton S. Analysis of Role Conflict and Role Ambiguity in a Structural Equations Framework. J Appl Psychol [Internet]. 1990;75(2):148-57. doi: https://doi.org/10.1037/0021-9010.75.2.148
21. Smith CS, Tisak J, Schmieder RA. The measurement properties of the role conflict and role ambiguity scales: A review and extension of the empirical research. J Organ Behav [Internet]. 1993;14(1):37-48. doi: https://doi.org/10.1002/job.4030140105
22. McGee GW, Ferguson CE, Seers A. Role Conflict and Role Ambiguity: Do the Scales Measure These Two Constructs? J Appl Psychol [Internet]. 1989;74(5):815-8. doi: https://doi.org/10.1037/0021-9010.74.5.815
23. Tracy L, Johnson TW. Measurement of role stress: dimensionality of scale items. Soc Behav Pers [Internet]. 1983;11(1):1-7. doi: https://doi.org/10.2224/sbp.1983.11.1.1
24. Khan A, Yusoff RBM, Khan MM, Yasir M, Khan F. Psychometric Analysis of Role Conflict and Ambiguity Scales in Academia. Int Educ Stud [Internet]. 2014;7(8):104-12. doi: https://doi.org/10.5539/ies.v7n8p104
25. Özbağ GK, Çekmecelioğlu HG, Ceyhun GÇ. Exploring the Effects of Perceived Organizational Impediments and Role Stress on Job Performance. Procedia Soc Behav Sci [Internet]. 2014;150:1129-36. doi: https://doi.org/10.1016/j.sbspro.2014.09.128
26. Kroupis I, Kourtessis T, Kouli O, Tzetzis G, Derri V, Mavrommatis G. Job satisfaction and burnout among Greek P.E. teachers. A comparison of educational sectors, level and gender. Cult. Cienc. y Deporte [Internet]. 2017;12(34):5-14. doi: https://doi.org/10.12800/ccd.v12i34.827
27. Lu M-H, Luo J, Chen W, Wang M-C. The influence of job satisfaction on the relationship between professional identity and burnout: A study of student teachers in Western China. Curr Psychol [Internet]. 2022;41(1):289-97. doi: https://doi.org/10.1007/s12144-019-00565-7
28. OECD. TALIS - The OECD Teaching and Learning International Survey. 2018 TALIS Results: Teachers and School Leaders as Lifelong Learners and Valued Professionals [Internet]. France: OECD. Available from: https://www.oecd.org/education/talis/
29. Maslach C, Jackson SE. The Measurement of Experienced Burnout. J Occup Behav [Internet]. 1981;2(2):99-113. doi: https://doi.org/10.1002/job.4030020205
30. Ho C-L, Au W-T. Teaching Satisfaction Scale: Measuring Job Satisfaction of Teachers. Educ Psychol Meas [Internet]. 2006;66(1):172-85. doi: https://doi.org/10.1177/0013164405278573
31. Sijtsma K, van der Ark LA. A tutorial on how to do a Mokken scale analysis on your test and questionnaire data. Br J Math Stat Psychol [Internet]. 2017;70(1):137-58. doi: https://doi.org/10.1111/bmsp.12078
32. Stochl J, Jones PB, Croudace TJ. Mokken scale analysis of mental health and well-being questionnaire item responses: a non-parametric IRT method in empirical research for applied health researchers. BMC Med Res Methodol [Internet]. 2012;12(1):1-16. doi: https://doi.org/10.1186/1471-2288-12-74
33. Mokken RJ. A theory and procedure of scale analysis. The Hague, Netherlands: De Gruyter Mouton; 2011. 364 p.
34. van der Ark LA. New developments in Mokken scale analysis in R. J Stat Softw [Internet]. 2012;48(5):1-27. doi: https://doi.org/10.18637/jss.v048.i05
35. R Development Core Team. R: A language and environment for statistical computing. R Foundation for Statistical Computing Vienna, Austria: R Foundation for Statistical Computing; 2013. Available from: http://www.R-project.org/
36. DeVon HA, Block ME, Moyle-Wright P, Ernst DM, Hayden SJ, Lazzara DJ, et al. A Psychometric Toolbox for Testing Validity and Reliability. J Nurs Scholarsh [Internet]. 2007;39(2):155-64. doi: https://doi.org/10.1111/j.1547-5069.2007.00161.x
37. Jöreskog KG, Olsson UH, Wallentin FY. Confirmatory factor analysis (CFA). In: Jöreskog KG, Olsson UH, Wallentin FY, editors. Multivariate analysis with LISREL: Springer; 2016. p. 283-339.
38. Dueber DM. Bifactor Indices Calculator: A Microsoft Excel-based tool to calculate various indices relevant to bifactor CFA models. Educational, School, and Counseling Psychology Research Tools. University of Kentucky’s Institutional Repository. 2017. doi: https://doi.org/10.13023/edp.tool.01
39. Reise SP, Scheines R, Widaman KF, Haviland MG. Multidimensionality and Structural Coefficient Bias in Structural Equation Modeling: A Bifactor Perspective. Educ Psychol Meas [Internet]. 2013;73(1):5-26. doi: https://doi.org/10.1177/0013164412449831
40. Reise SP, Bonifay WE, Haviland MG. Scoring and Modeling Psychological Measures in the Presence of Multidimensionality. J Person Assess [Internet]. 2013;95(2):129-40. doi: https://doi.org/10.1080/00223891.2012.725437
41. Yaacob M, Long CS. Role of Occupational Stress on Job Satisfaction. Mediterr J Soc Sci [Internet]. 2015;6(2 Suppl 1):81-7. doi: https://doi.org/10.5901/mjss.2015.v6n2s1p81
42. R Richards KA, Washburn NS, Hemphill MA. Exploring the influence of perceived mattering, role stress, and emotional exhaustion on physical education teacher/coach job satisfaction. Eur Phy Educ Rev [Internet]. 2019;25(2):389-408. doi: https://doi.org/10.1177/1356336X17741402
43. Xu L. Teacher-researcher role conflict and burnout among Chinese university teachers: a job demand-resources model perspective. Stud High Educ [Internet]. 2019;44(6):903-19. doi: https://doi.org/10.1080/03075079.2017.1399261