Normative Values for the Spanish Version of the Voice Symptom Scale (VoiSS)
Valores normativos para la versión española de la Voice Symptom Scale (VoiSS)
Antonio Velandrino-Nicolás, Francisco Cabello Luque , María Monteagudo-Santamaría, Lidia Gómez-Cobos
Abstract
Objective: The aim of this study was to establish normative values for the Voice Symptom Scale (VoiSS) in the Spanish community population (without voice problems), using a sample from a large area of southeastern Spain.
Method: The sample consisted of 115 adults from ages 16 to 87, 60 of whom were women and 55 were men. Participants included the family members of patients who attended the Otorhinolaryngology (ENT) and Speech Therapy Clinic at a referral hospital in the region of Murcia, Spain, and some of the clinic’s staff. All the participants reported never having suffered from any voice disorder before.
Results: The normative values obtained in this study for the VoiSS were 14.61 (SD=8.18) for the total score, 7.57 (SD = 5.42) for the Impairment subscale, 1.04 (SD = 1.65) for the Emotional subscale, and 5.99 (SD = 3.61) for the Physical subscale. The percentile values were also obtained for the VoiSS scale and for its three subscales.
Conclusions: This study presents normative values for the VoiSS scale that have not previously been obtained in Spain. These values can be used as a reference to detect possible voice disorders.
Keywords
VoiSS; voice; voice disorders; voice quality; voice hoarseness; scale; questionnaire; self report; population statistics; psychometrics.
Resumen
Objetivo: El objetivo de este estudio fue establecer valores normativos para la escala Voice Symptom Scale (VoiSS) en población comunitaria española (sin problemas de voz), utilizando una muestra de un área extensa del sureste de España.
Metodología: La muestra estuvo compuesta por 115 personas (60 mujeres y 55 hombres) con edades comprendidas entre los 16 y 87 años. Los participantes eran familiares que acompañaron a los pacientes a las sesiones clínicas de ORL y de Logopedia de un hospital de referencia de la Región de Murcia, así como personal del hospital. Todos declararon no padecer ningún trastorno de la voz.
Resultados: Los valores normativos obtenidos en este estudio para el VoiSS fueron 14.61 (SD=8.18) para la puntuación total, 7.57 (SD = 5.42) para la subescala Limitación, 1.04 (SD = 1.65) para la subescala Emocional y 5.99 (SD = 3.61) para la subescala Física. Los valores percentílicos se obtuvieron también para la escala VoiSS y para sus tres subescalas.
Conclusiones: Este estudio presenta valores normativos para la escala VoiSS que no han sido todavía obtenidos en España. Estos valores pueden utilizarse como referencia para detectar posibles trastornos de voz.
Palabras clave
VoiSS; voz; trastornos de la voz; calidad de la voz; ronquera; escala; cuestionario; autoinforme; estadísticas poblacionales; psicometría.
Introduction
From the 1990s, the evaluation of dysphonic patients has shifted to an approach in which self-reports and Quality of Life (QOL) measurements are included in the evaluation protocols for voice disorders [1,2], thus following the tendency to include QOL measurements in all health-related areas [3-5], and an increasing number of self-reported or patient-reported instruments have been developed [6,7].
One of such self-reported instruments is the Voice Symptom Scale (VoiSS), a scale developed by Deary et al. [8] that includes 30 question items grouped into three subscales (Impairment, Emotional, and Physical), which provide information about the use of voice for communication, the impact of the voice disorder on the life of the individual, and about the perception of physical symptoms.
Arguably the most relevant feature of the VoiSS is that some data suggest it to be the more rigorous and psychometrically robust self-reported measure [9,10]. The VoiSS has a test-retest coefficient of 0.63, a correlation with the Voice Handicap Index (VHI) of 0.87, and a sensitivity to change of up to 1.06, the latter value being particularly noteworthy as it is also the only scale that does not show a floor effect of the analyses carried out to date [10,11]. It has also been found to have perfect classificatory power [11], with sensitivity, specificity, and efficiency values of 1.0, Besides, it is also the only self-reported scale that included input from the target population of dysphonic patients during item generation [12].
For these reasons, the VoiSS has gained attention as an alternative measure to the Voice Handicap Index, which, although still the most popular measure, has not been free of criticism and limitations [12-14]. Due to such high interest in the VoiSS, numerous adaptations to various cultural and linguistic contexts [15-20], including Spanish [18] and Chilean Spanish [19], have resulted.
Most studies using the VoiSS as a measure have compared the scores of relatively small samples of participants with and without voice pathology [15-21]. Although this approach seems to be most practical, the use of normative data from a bigger sample of vocally healthy individuals can also be an important strategy to help understand the psychometric values of the scale, its sensitivity to discriminate patients with dysphonia, and to set reference values for the comparison of patients with voice disorders.
Normative data has been published for some self-reported voice scales such as the Voice Handicap Index-10 [22] or the Singers Voice Handicap Index-10 [23], but not for the VoiSS. The goal of this study was to establish normative data for the voice scale of the general population in Spain who were free from a history of voice problems, using a sample from an extensive area covering the southeast region of Spain.
Methods
The study was approved by the Ethics Research Committee of the University of Murcia (registration number 2824/2020). All participants read and signed an informed consent form.
Participants
A total of 115 people participated in the study. They were either relatives of patients who attended the Otorhinolaryngology (ENT) and Speech Therapy Services Clinic of a referral hospital located in Murcia, Spain, or staff of this clinic. Inclusion criteria were as follows: first, the participants had to be native Spanish speakers from Spain; second, they had to be able to complete the scale independently; and third, the participants had to have no prior history of voice problems that required clinical treatment. Individuals who did not understand Spanish or who were not able to complete the questionnaire by themselves were excluded. Participants were debriefed on the study and their participation and, after having read and signed an informed consent form, they were taken to a quiet room where they completed the questionnaire without any interruption. The longest time required for completion was 22 minutes.
Technical information
The Spanish version of the VoiSS Scale [8] was used. This scale consists of 30 items divided into three subscales. The Impairment subscale contains 15 question items related to difficulties that patients may find when using their voice (e.g., Do you have difficulty attracting attention using your voice?), the Emotional subscale consists of 8 items related to the psychological impact of the voice problem (e.g., Do you feel miserable or depressed because of your voice problem?), and the Physical subscale consists of 7 items related to physical symptoms (e.g., Is your throat sore?). Several socio-demographic questions were added for age, gender, and for whether or not the participant had suffered from any voice problem requiring clinical treatment.
Statistics
Statistical analyses were conducted using the Jamovi software [24]. Descriptive statistics were calculated for participant age, as a total and by gender. A hypothesis contrast was used to analyze significant differences between men and women by their age.
Descriptive statistics were also calculated for the global scores in the VoiSS and in each of the three subscales, Impairment, Emotional, and Physical. These statistics included amplitude (with maximum and minimum scores), mean, standard deviation, and median; they were calculated for all participants and by gender. Student’s t contrast was used to analyze possible differences in the scale scores due to gender, and Cohen’s d was used to estimate size effect for each statistical contrast [25]. The size effect quantifies the size of the mean differences between groups to obtain the magnitude of a differential effect and allows for a better understanding of the found differences (together with the p value). According to general recommendations, 0.2 was considered a small size effect, 0.5 a moderate size effect, and 0.8 a large size effect.
The correlation between age and score in the VoiSS scale was calculated to estimate their possible association, which would then require the calculation of differential normative values for that specific variable.
Percentile distribution tables were built for the total VoiSS score and for scores in each of the three subscales. Percentiles (variable values below which a given percentage of scores falls) are the most used standardized values for the normative interpretation of a test [26,27]. Percentiles transform the original scores in order to facilitate their interpretation, are easy to understand, and allow for the comparison of scores of different individuals in the same test, and of scores of the same individual in different tests [26]. Percentile graphs were also calculated for the scores in each subscale of the VoiSS.
Results
Participant age distribution by gender (see Table 1) did not show statistically significant differences (p > .05) between women and men, with mean scores 45.34 (SD = 17.36) and 45.60 (SD = 16.39) years, respectively. The other descriptive statistics for age also showed very similar scores between men and women.
Table 1. Distribution of age total and according to gender.
| Gender | Age (years) | ||||
|---|---|---|---|---|---|
| n | R | M | SD | Md | |
| Females | 60 | 16 - 87 | 45.34 | 17.36 | 44.5 |
| Males | 55 | 18 - 74 | 45.60 | 16.39 | 46 |
| Total | 115 | 16 - 87 | 45.47 | 16.83 | 45.0 |
Note. n: sample size; R: range (minimum - maximum); M: mean; SD: standard deviation; Md: median.
The mean scores in the three subscales of the VoiSS scale were similar for men and women (Table 2). No significant differences were found for the total score (t(113) = 0.353, p > .05), the Impairment subscale (t(113) = -0.914; p > .05), the Emotional subscale (t(113) = 1.781, p > .05), nor the Physical subscale (t(113) = 1.375; p > .05). Effect sizes were 0.07 for the total score, -0.17 for Impairment, 0.33 for Emotional, and 0.26 for the Physical subscales.
Table 2. Normative scores for the VoiSS scale and subscales according to gender.
| Females | Males | Total | ||
|---|---|---|---|---|
| (n=60) | (n=55) | (n=115) | ||
| Impairment | R | 0-19 | 0-20 | 0-20 |
| M | 8.02 | 7.09 | 7.57 | |
| SD | 5.65 | 5.16 | 5.42 | |
| Md | 7.5 | 6.0 | 7.0 | |
| Emotional | R | 0.7 | 0.7 | 0.7 |
| M | 0.78 | 1.33 | 1.04 | |
| SD | 1.43 | 1.84 | 1.65 | |
| Md | 0.0 | 0.0 | 0.0 | |
| Physical | R | 0-16 | 1-15 | 0-16 |
| M | 5.55 | 6.47 | 5.99 | |
| SD | 3.61 | 3.60 | 3.61 | |
| Md | 5.0 | 5.0 | 5-0 | |
| Total | R | 0-30 | 4-28 | 0-30 |
| M | 14.35 | 14.89 | 14.61 | |
| SD | 8.71 | 7.64 | 8.18 | |
| Md | 13.0 | 13.0 | 13.0 |
Note. n: sample size; R: range (minimum - maximum); M: mean; SD: standard deviation; Md: median.
Associations between age and the scores in the three subscales of the VoiSS were low or very low and without significance (p > .05). The correlation between age and the total score was r = .05, and regarding the three subscales, was r = .03 for the Limitation subscale, r = .14 for the Emotional subscale and r = .01 for the Physical subscale, using p > .05.
Mean scores were 14.61 (SD = 8.18) for the total scale, 7.57 (SD = 5.42) for the Impairment subscale, 1.04 (SD = 1.65) for the Emotional subscale, and 5.99 (SD = 3.61) for the Physical subscale.
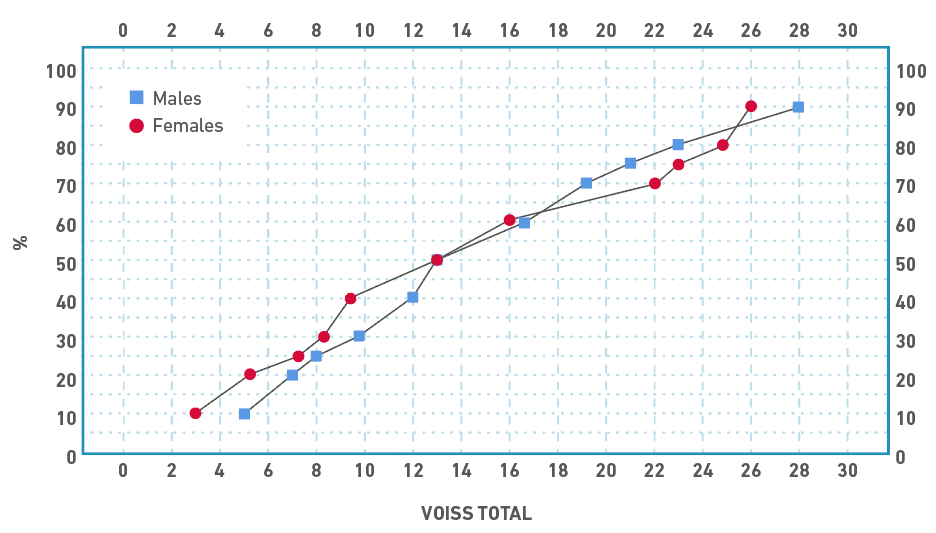
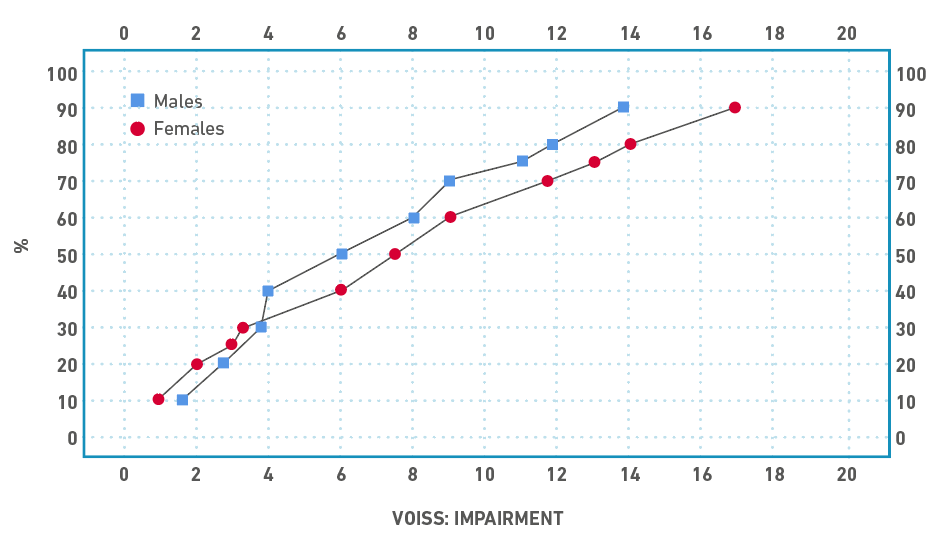
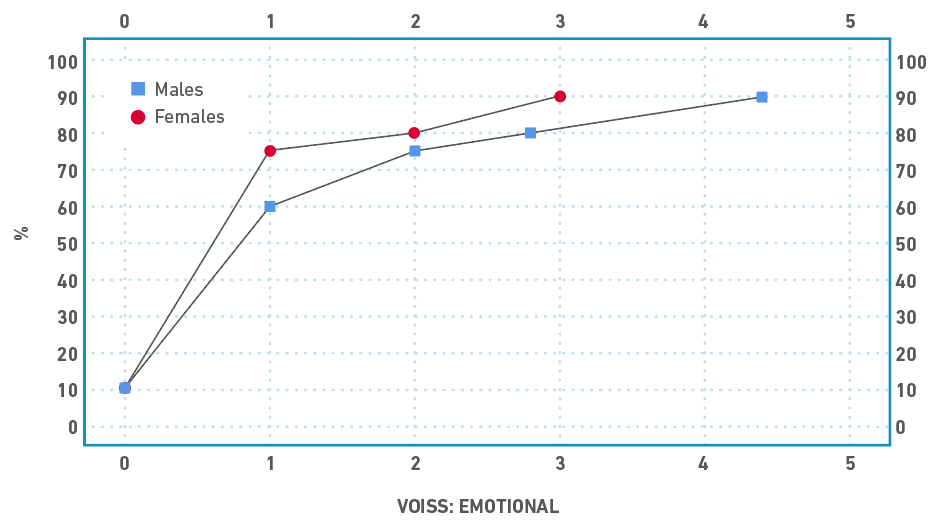
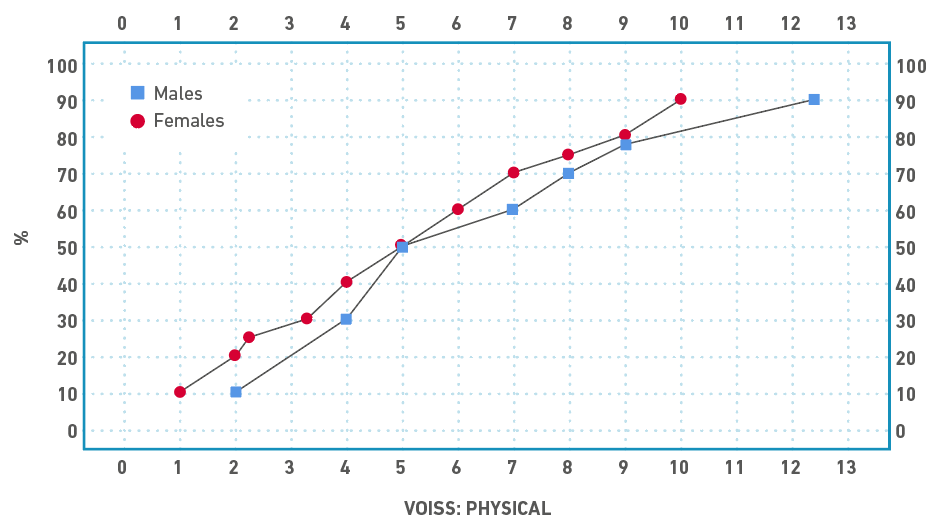
Transformation into percentile scores was performed using the percentile range procedure [25] which has been regarded as the easiest and more direct procedure, offering accurate adjustment to the accumulated percentages. Table 3 shows percentile scores for each of the three subscales of the VoiSS scale. For higher precision, percentile scores are displayed separately for women and men, given the obtained effect sizes. Percentile graphs are included for the total scores (Figure 1), scores in the Impairment subscale (Figure 2), scores in the Emotional subscale (Figure 3), and scores in the Physical subscale (Figure 4).
Table 3. Percentiles for the scores of the VoiSS scale and subscales according to gender.
| Percentile | Impairment | Emotional | Physical | Total |
|---|---|---|---|---|
| Female | ||||
| 10 | 1,0 | 0,0 | 1,0 | 3,0 |
| 20 | 2,0 | 0,0 | 2,0 | 5,2 |
| 25 | 3,0 | 0,0 | 2,2 | 7,2 |
| 30 | 3,3 | 0,0 | 3,3 | 8,3 |
| 40 | 6,0 | 0,0 | 4,0 | 9,4 |
| 50 | 7,5 | 0,0 | 5,0 | 13,0 |
| 60 | 9,0 | 0,0 | 6,0 | 16,0 |
| 70 | 11,7 | 0,0 | 7,0 | 22,0 |
| 75 | 13,0 | 1,0 | 8,0 | 23,0 |
| 80 | 14,0 | 2,0 | 9,0 | 24,8 |
| 90 | 16,9 | 3,0 | 10,0 | 26,0 |
| Male | ||||
| 10 | 1,6 | 0,0 | 2,0 | 5,0 |
| 20 | 3,0 | 0,0 | 4,0 | 7,0 |
| 25 | 3,0 | 0,0 | 4,0 | 8,0 |
| 30 | 3,8 | 0,0 | 4,0 | 9,8 |
| 40 | 4,0 | 0,0 | 5,0 | 12,0 |
| 50 | 6,0 | 0,0 | 5,0 | 13,0 |
| 60 | 8,0 | 1,0 | 7,0 | 16,6 |
| 70 | 9,0 | 2,0 | 8,0 | 19,2 |
| 75 | 11,0 | 2,0 | 9,0 | 21,0 |
| 80 | 11,8 | 2,8 | 9,0 | 23,0 |
| 90 | 13,8 | 4,4 | 12,4 | 28,0 |
Figure 1. Percentile chart for the VoiSS total score.
Figure 2. Percentile chart for the VoiSS Impairment subscale score.
Figure 3. Percentile chart for the VoiSS Emotional subscale score.
Figure 4. Percentile chart for the VoiSS Physical subscale score.
Discussion
The VoiSS is a scale developed by Deary et al. [8] in 2003 that assesses the handicap level experienced by patients with voice disorders as a consequence of the vocal impairment, and has been found to be one of the patient-informed measures with better psychometric properties [9-11]. To be used correctly, however, a scale must not simply possess adequate metric properties (i.e., reliability, validity, sensitivity, etc.) and be easy to interpret for clinicians [28], but the obtained scores must be interpreted to evaluate its clinical significance and to contribute to the patient's diagnosis (either in a determinate moment or across a period of time). One of the commonly used procedures for this interpretation of scores is to obtain percentile values, consisting of values below which a given percentage of scores fall. There are many examples of measurement instruments in the field of speech pathology that offer percentile values as part of their normative data, such as the Battelle Development Index [29] or the Peabody Picture Vocabulary Test [30]. Obtaining a percentile allows for an easy and fast method of obtaining an initial, yet rigorous interpretation of where a certain patient is placed in comparison with the normative group.
As indicated by Arffa et al. [22], by using the results of a study like the one reported here, clinicians can now compare the score obtained in the VoiSS by a patient with voice disorders with the normative values. The normative values from self-reports can be helpful to define a normality standard or benchmark [31,32]. These comparison values are both the mean score in the normative sample (M = 14.61, SD = 8.18) and the percentile scores (Table 3 and Figures 1, 2, 3 and 4).
These values can be used as normative data using the typical formula of mean plus two standard deviations. Specifically, for the total VoiSS score, the normative scores are 30.9 (14.61 + (8.18) x 2)), 18.41 (7.57 + (5.42) x 2)) for the Impairment subscale, (1.04 + 1.65 x 2)) for the Emotional subscale 4.34 , and 13.21 (5.99 + 3.61 x 2)) for the Physical subscale. That is, individuals with total scores in the VoiSS higher than 30, or higher than 18 in the Impairment subscale, higher than 4 in the Emotional subscale or higher than 13 in the Physical subscale, could be considered to show non-normal scores.
The obtained normative values can be compared with those found in other validation studies for the VoiSS scale [15-17]. Table 4 shows the results reported in these other studies, including the country, the sample size, the mean score, and the standard deviation. The mean value of the total score for the VoiSS found in this study is in the intermediate zone of the values reported in other countries. In this regard, the study by Contreras et al. [20] reports the higher score (M = 22.30, SD = 16.0), a finding that the authors attribute to a cultural difference so that Chilean patients consider their voices as normal, in spite of the presence of small vocal alterations. A similar explanation could be used to interpret the mean scores reported here, although further investigation should address this hypothesis.
Table 4. Basic statistics of VoiSS in several studies.
Note. n: sample size; M: Mean; SD: standard deviation.
Age was found not to be associated neither with the total VoiSS scores nor the scores in each of the three subscales. This finding was expected, given that vocally healthy individuals do not have to necessarily show vocal symptoms as they age.
Limitations and recommendations
The main limitation of this study is the classification of an individual as “without any voice problem”, based solely on the participant’s declaration. For this reason, for further studies, it would be recommended to perform an analysis of voice samples from the participants (perceptual, acoustic or of some other type) to determine the absence of vocal problems. A bigger sample size would also be necessary, although the validation studies of the VoiSS scale found in the literature use similar sample sizes to that in this study. Also, the unintentional selection of the participants could have contributed to the elimination or reduction of representativeness biases.
Conclusions
Normative values for the VoiSS scale obtained in the current investigation, for native Spanish speakers from Spain, have been 14.61 (SD = 8.18) for the total VoiSS score, 7.57 (SD = 5.42) for the Impairment subscale, 1.04 (SD = 1.65) for the Emotional subscale, and 5.99 (SD = 3.61) for the Physical subscale. These values can be used to assess possible voice disorders. As a second procedure for score interpretation, the percentile scores reported here can be used to assess these problems in relation to the normative group.
References
1. Hogikyan ND, Rosen CA. A Review of Outcome Measurements for Voice Disorders. Otolaryngol Head Neck Surg [Internet]. 2002 May;126(5):562-72. doi: http://dx.doi.org/10.1067/mhn.2002.124850
2. World Health Organization. WHOQOL measuring quality of life [Internet]. New York: WHO; 2012. Available from: https://www.who.int/tools/whoqol
3. Lohr K. Assessing health status and quality-of-life instruments: attributes and review criteria. Qual Life Res. 2002;11(3):193-205. doi: https://doi.org/10.1023/A:1015291021312
4. Patrick DL, Burke LB, Powers JH, Scott JA, Rock EP, Dawisha S, et al. Patient-reported outcomes to support medical product labeling claims: FDA perspective. Value Health. 2007;10(suppl 2):S125-37. doi: http://dx.doi.org/10.1111/j.1524-4733.2007.00275.x
5. Dejonckere PH, Bradley P, Clemente P, Cornut G, Crevier-Buchman L, Friedrich G, et al. A basic protocol for functional assessment of voice pathology, especially for investigating the efficacy of (phonosurgical) treatments and evaluating new assessment techniques. Eur Arch Otorhinolaryngol [Internet]. 2001 Feb;258(2):77-82. doi: http://dx.doi.org/10.1007/s004050000299
6. Branski RC, Cukier-Blaj S, Pusic A, Cano SJ, Klassen A, Mener D, et al. Measuring quality of life in dysphonic patients: A systematic review of content development in patient-reported outcomes measures. J Voice. 2010;24(2):193-8. doi: http://dx.doi.org/10.1016/j.jvoice.2008.05.006
7. Francis DO, Daniero JJ, Hovis KL, Sathe N, Jacobson B, Penson DF, et al. Voice-related patient-reported outcome measures: A systematic review of instrument development and validation. J Speech Lang Hear Res. 2017;60(1):62-88. doi: http://dx.doi.org/10.1044/2016_JSLHR-S-16-0022
8. Deary IJ, Wilson JA, Carding PN, Mc Kenzie K. VoiSS: a patient-derived voice symptom scale. J Psychosom Res. 2003;54(5):483-9. doi: http://dx.doi.org/10.1016/S0022-3999(02)00469-5
9. Webb AL, Carding PN, Deary IJ, MacKenzie K, Steen IN, Wilson JA. Optimising outcome assessment of voice interventions, I: Reliability and validity of three self-reported scales. J Laryng Otol. 2007;121(8):763-7. doi: http://dx.doi.org/10.1017/S0022215107007177
10. Steen IN, Mackenzie K, Carding PN, Webb A, Deary IJ, Wilson JA. Optimising outcome assessment of voice interventions, II: Sensitivity to change of self-reported and observer-rated measures. J Laryngol Otol. 2007;122(1):46-51. doi: http://dx.doi.org/10.1017/S0022215107007839
11. Behlau M, Madazio G, Moreti F, Oliveira G, Alves Dos Santos LdM, Paulinelli BR, et al. Efficiency and cutoff values of self-Assessment instruments on the impact of a voice problem. J Voice. 2016;30(4):506.e9-506.e18. doi: http://dx.doi.org/10.1016/j.jvoice.2015.05.022
12. Wilson JA, Webb A, Carding PN, Steen IN, MacKenzie K, Deary IJ. The Voice Symptom Scale (VoiSS) and the Vocal Handicap Index (VHI): a comparison of structure and content. Clin Otolaryngol Allied Sci [Internet]. 2004 Apr 26;29(2):169-74. doi: http://dx.doi.org/10.1111/j.0307-7772.2004.00775.x
13. Carding PN, Steen I, Webb A, Mackenzie K, Deary IJ, Wilson JA. The reliability and sensitivity to change of acoustic measures of voice quality. Clin Otolaryngol Allied Sci. 2004;29(5):538-44. doi: http://dx.doi.org/10.1111/j.1365-2273.2004.00846.x
14. Wilson JA, Webb AL, Carding PN, Steen N, MacKenzie K, Deary IJ. The Voice Symptom Scale (VoiSS) and the Vocal Handicap Index (VHI): a comparison of structure and content. Clin Otolaryngol Allied Sci. 2004;29(2):169-74. doi: http://dx.doi.org/10.1111/j.0307-7772.2004.00775.x
15. Mozzanica F, Robotti C, Ginocchio D, Bulgheroni C, Lorusso R, Behlau M et al. Cross-cultural adaptation and validation of the Italian Version of the Voice Symptom Scale (I-VoiSS). J Voice. 2017;31(6):773e1-e10. doi: http://dx.doi.org/10.1016/j.jvoice.2017.02.001
16. Moreti F, Zambon F, Oliveira G, Behlau M. Cross-cultural adaptation, validation, and cutoff values of the Brazilian version of the Voice Symptom Scale-VoiSS. J Voice. 2014;28(4):458-68. doi: http://dx.doi.org/10.1016/j.jvoice.2013.11.009
17. Son H, Lee C, Kim K, Kim S, Jeong H, Kim J. The Korean version of the Voice Symptom Scale for patients with thyroid operation, and its use in a validation and reliability study. J Voice. 2018;32(3):367-73. doi: http://dx.doi.org/10.1016/j.jvoice.2017.06.003
18. Velandrino A, Cabello F, Parra M, Nicolás MJ, Losana E. Cultural adaptation and pilot study of the Spanish version of the Voice Symptom Scale (VoiSS). Rev Log Fon Aud. 2018;38(4):141-84. doi: http://dx.doi.org/10.1016/j.rlfa.2018.07.003
19. Ruston FC, Moreti F, Vivero M, Malebran C, Behlau M. Cross-cultural adaptation of the Chilean version of the Voice Symptom Scale - VoiSS. Codas. 2016;28(5):625-33. doi: http://dx.doi.org/10.1590/2317-1782/20162015249
20. Contreras F, Moreti F, Vivero M, Malebran C, Behlau M. Cross-Cultural adaptation, validation, and cutoff values of the Chilean version of the Voice Symptom Scale: VoiSS. J Voice. 2021;35(3):498.e31-498.e38. doi: http://dx.doi.org/10.1016/j.jvoice.2019.09.020
21. Correa S, Ribeiro VV, Behlau M. Chilean's Self-Perception of Their Self-Regulatory Behaviors and Vocal Symptoms. J Voice. 2022;36(2):292.e23-292.e28. doi: http://dx.doi.org/10.1016/j.jvoice.2020.04.036
22. Arffa RE, Krishna P, Gartner-Schmidt J, Rose CA. Normative values for the Voice Handicap Index-10. J Voice. 2012;26(4):462-5. doi: http://dx.doi.org/10.1016/j.jvoice.2011.04.006
23. Sobol M, Sielska-Badurek, EM, Osuch-Wójcikiewicz E. Normative values for singing voice handicap index - systematic review and meta-analysis. Braz J Otorhinolaryngol. 2020;86(4):497-501. doi: https://doi.org/10.1016/j.bjorl.2018.12.004
24. Jamovi [computer program on the internet]. Version 2.3. 2023. Available from: https://www.jamovi.org
25. Botella Ausina J, Sánchez Meca J. Meta-análisis en ciencias sociales y de la salud. Madrid: Síntesis; 2015. 266 p. Available from: https://dialnet.unirioja.es/servlet/libro?codigo=746252
26. Abad FJ, Olea J, Ponsoda V, García C. Medición en ciencas sociales y de la salud. Madrid: Síntesis; 2011. 566 p. Available from: https://dialnet.unirioja.es/servlet/libro?codigo=552272
27. Streiner DL, Norman GR, Cairney J. Health measurement scales: a practical guide to their development and use. 5th ed. United Kingdom: Oxford University Press. 2015.
28. Fayers PM, Machin D. Quality of Life. The assessment, analysis and reporting of patient-reported outcomes. London: John Wiley & Sons; 2016. 648 p.
29. Newborg J, Stock J, Wnek L. Inventario de Desarollo Batelle. Manual de aplicación. Madrid: Tea Ediciones; 2011. 168 p.
30. Dunn LM, Dunn, Leota M, Arribas D. PPVT-III Peabody. Test de vocabulario en imágenes: Manual. Madrid: TEA; 2010. 102 p.
31. Hartnick CJ, Volk M, Cunningham, M. Establishing normative voice-related quality of life scores within the pediatric otolaryngology population. Arch Otolaryngol Head Neck Surg. 2003;129(10):1090-93. doi: https://doi.org/10.1001/archotol.129.10.1090
32. Blumin J., Keppel KL, Braun NM, Kerschner JE, Merati AL. The impact of gender and age on voice related quality of life in children: Normative data. Int J Pediatr Otorhinolaryngol. 2008;72(2):229-34. doi: https://doi.org/10.1016/j.ijporl.2007.10.015
